Observations made by Earth-based radar telescopes and the MErcury Surface, Space ENvironment, GEochemistry, and Ranging (MESSENGER) spacecraft provided compelling evidence for water ice in Mercury’s polar craters. In our investigation, we constructed higher-resolution (125 m/pixel) digital elevation models (DEMs) for four of the largest northernmost craters, Kandinsky, Tolkien, Chesterton, and Tryggvóttir. The DEMs were leveraged to model solar illumination and the thermal environment, products which were used to identify permanently shadowed regions and simulate surface temperatures. From these models, we predicted the regions of surface stability for ice and volatile organic compounds. These predictions were then compared against the Arecibo radar, Mercury Laser Altimeter (MLA), and Mercury Dual Imaging System (MDIS) data. Our radar analysis shows that areas of high radar backscatter are correlated with areas predicted to host surface ice. Additionally, we identify radar backscatter heterogeneities within the deposits that could be associated with variations in ice purity, mantling of the ice, or ice abundances. The MDIS analysis did not reveal conclusive evidence for ice or volatiles at the surface, while MLA results support the presence of water ice at the surface in these craters. However, evidence for boundaries between the surface ice and low-reflectance volatile organic compounds, as suggested could be present by our models, was inconclusive due to the limited MESSENGER data in these regions. BepiColombo's upcoming orbital mission at Mercury has the opportunity to obtain new measurements of these high-latitude craters and test our predictions for the distribution of surface volatiles in these environments.
| Preview | Filename | Description |
|---|---|---|
|
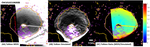
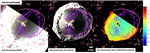
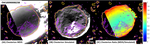
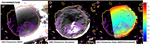
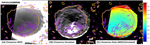
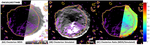
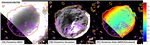
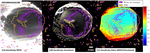
figure1b.png |
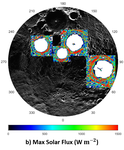
Maximum solar flux (Wm^-2) in Kandinsky, Tolkien, Chesterton, and Tryggvadottir |

|
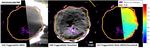
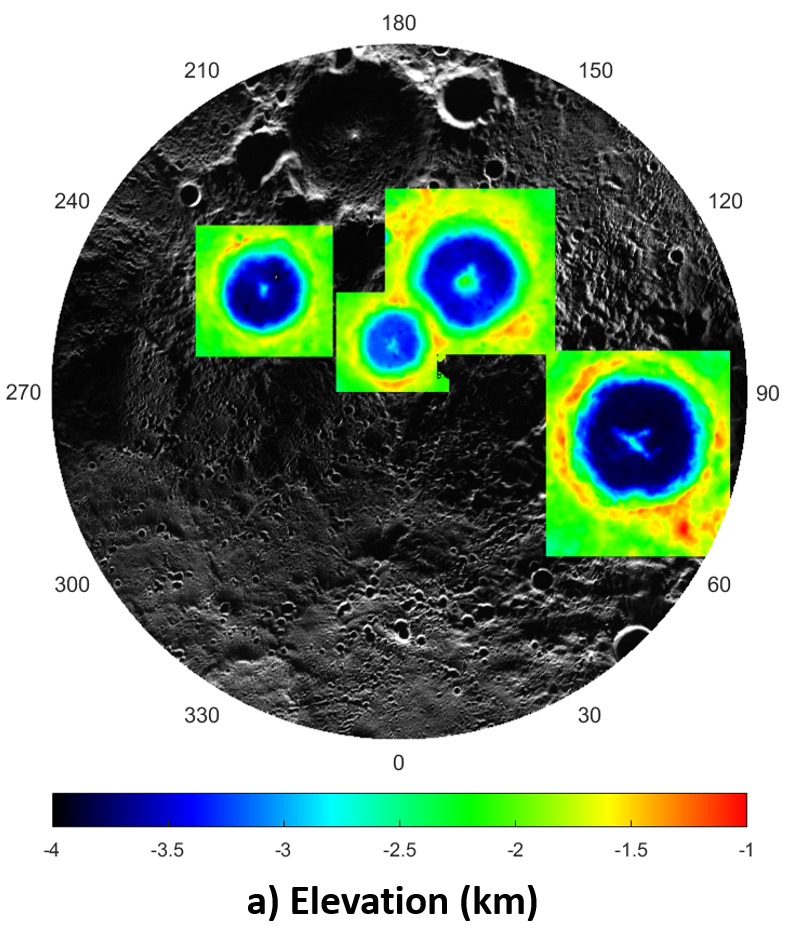
figure1a.png |
DEMs (km) of Kandinsky, Tolkien, Chesterton, and Tryggvadottir |
|
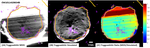
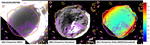
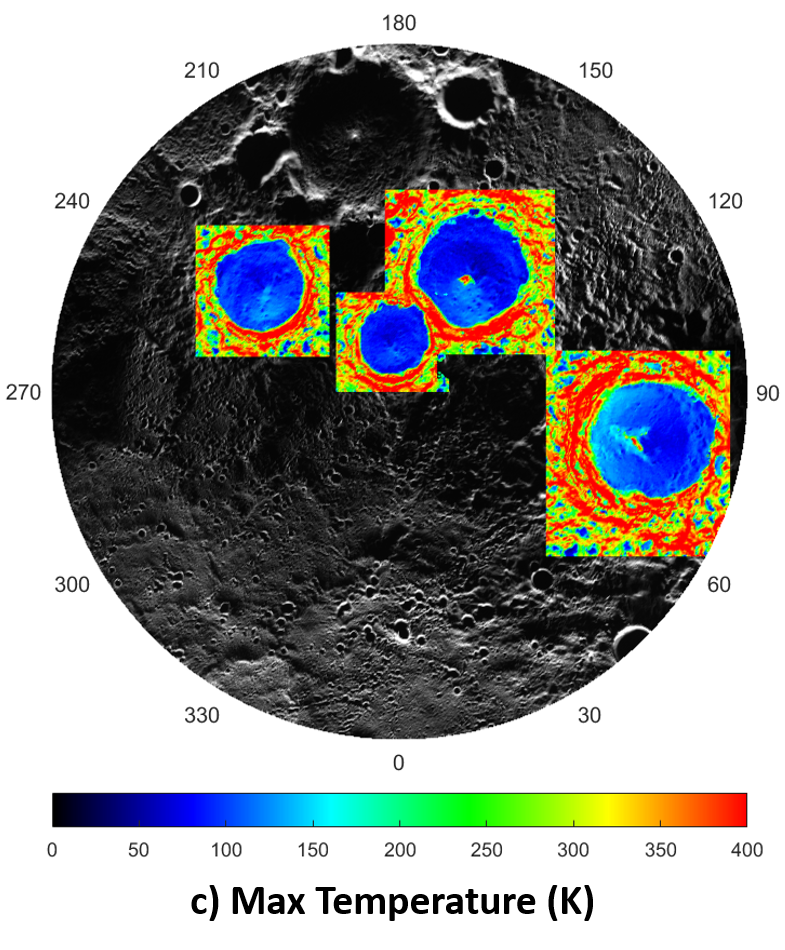
figure1c.png |
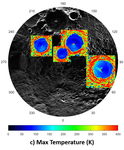
Maximum surface temperature (K) of Kandinsky, Tolkien, Chesterton, and Tryggvadottir |
|
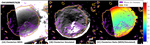
figure1d.png |
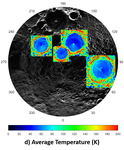
Average surface temperature (K) of Kandinsky, Tolkien, Chesterton, and Tryggvadottir |
|
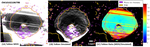
figure1f.png |
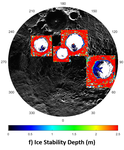
Ice stability depth (m) in Kandinsky, Tolkien, Chesterton, and Tryggvadottir |
|
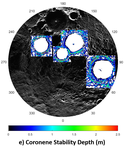
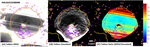
figure1e.png |
Coronene stability depth (m) in Kandinsky, Tolkien, Chesterton, and Tryggvadottir |
|
|
chesterton_raw.zip |
Raw images and models for Chesterton |
|
|
kandinsky_raw.zip |
Raw images and models for Kandinsky |
|
|
tolkien_raw1.zip |
Raw images and models for Tolkien |
|
|
tyrggvadottir_raw1.zip |
Raw images and models for Tryggvadottir |
|
|
chesterton_stack_82mpp_readme.pdf |
Chesterton USGS ISIS stack README |
|
|
kandinsky_stack_94mpp_readme.pdf |
Kandinsky USGS ISIS stack README |
|
|
tolkien_stack_86mpp_readme.pdf |
Tolkien USGS ISIS stack README |
|
|
tryggvadottir_stack_86mpp_readme.pdf |
Tryggvadottir USGS ISIS stack README |
|
|
mlaradr_55n_90n_readme.txt |
MLA Data README |
|
|
mlaradr_55n_90n.txt |
MLA Data between 55N and 90N |
|
|
mercury_radar.cub |
Radar .cub |
|
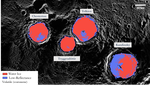
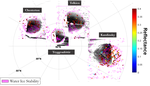
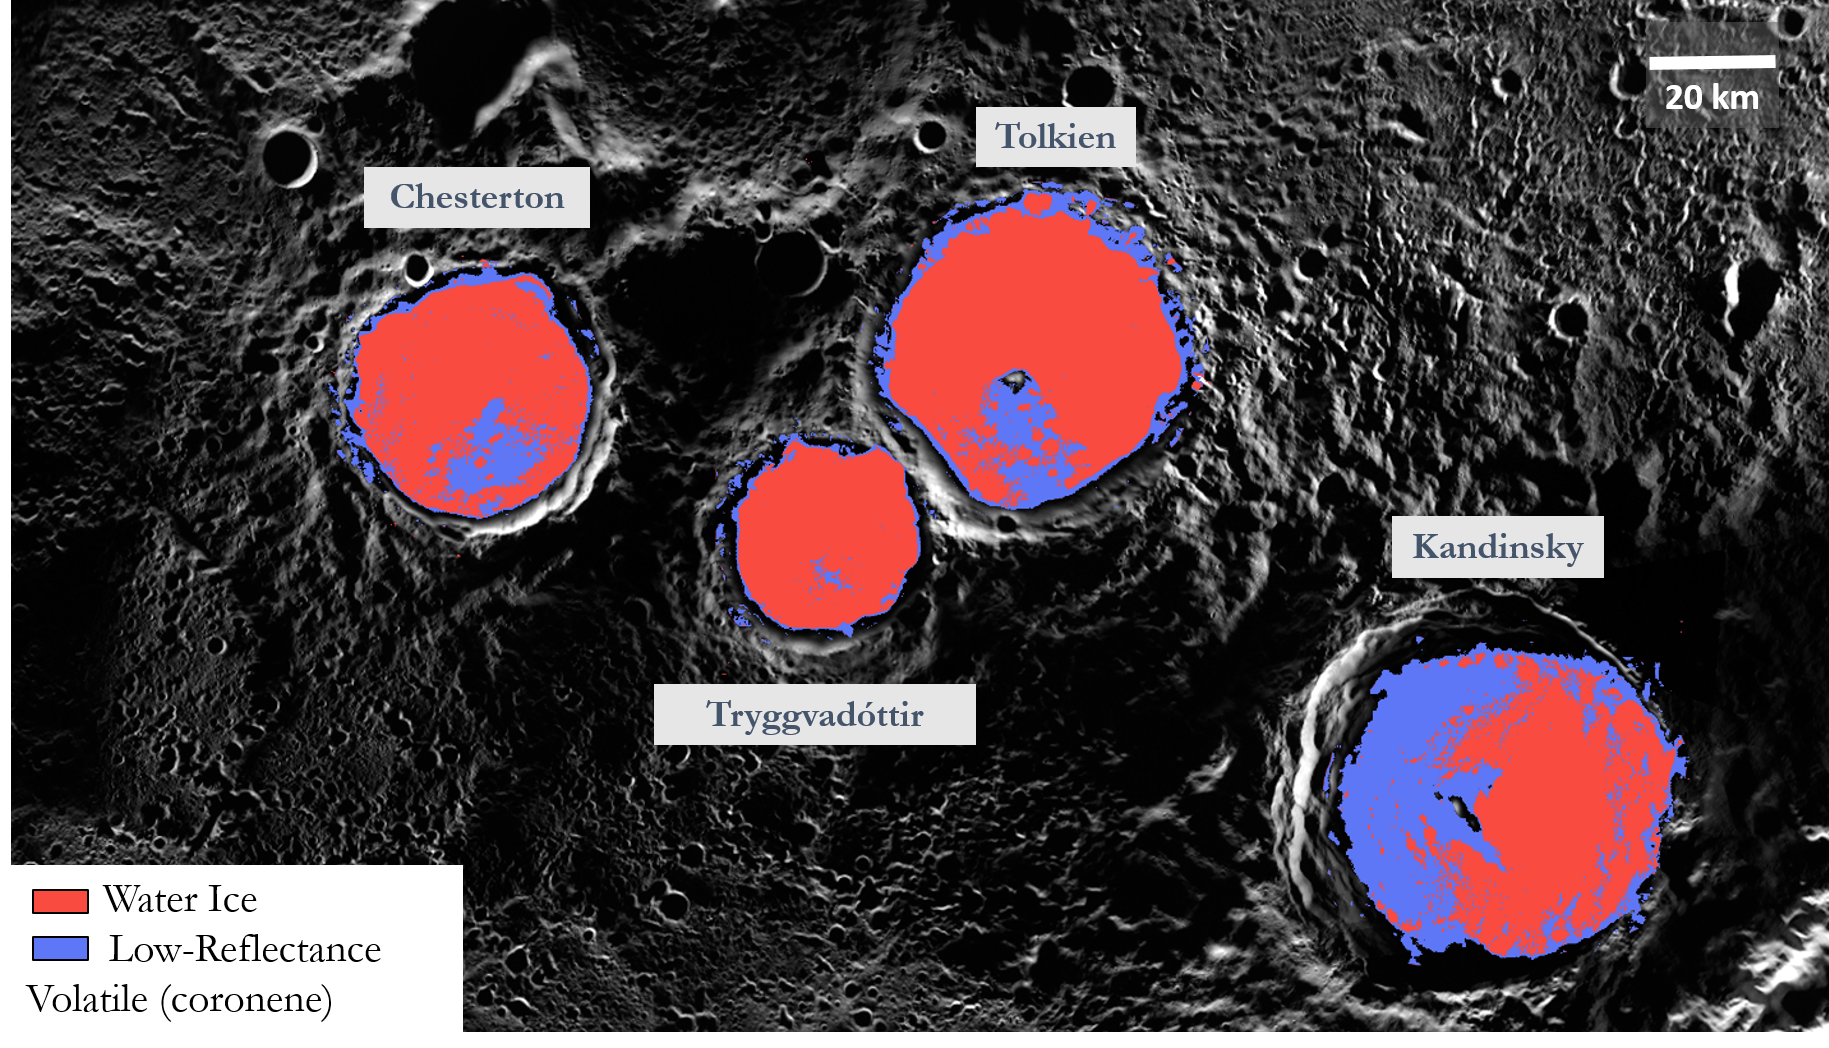
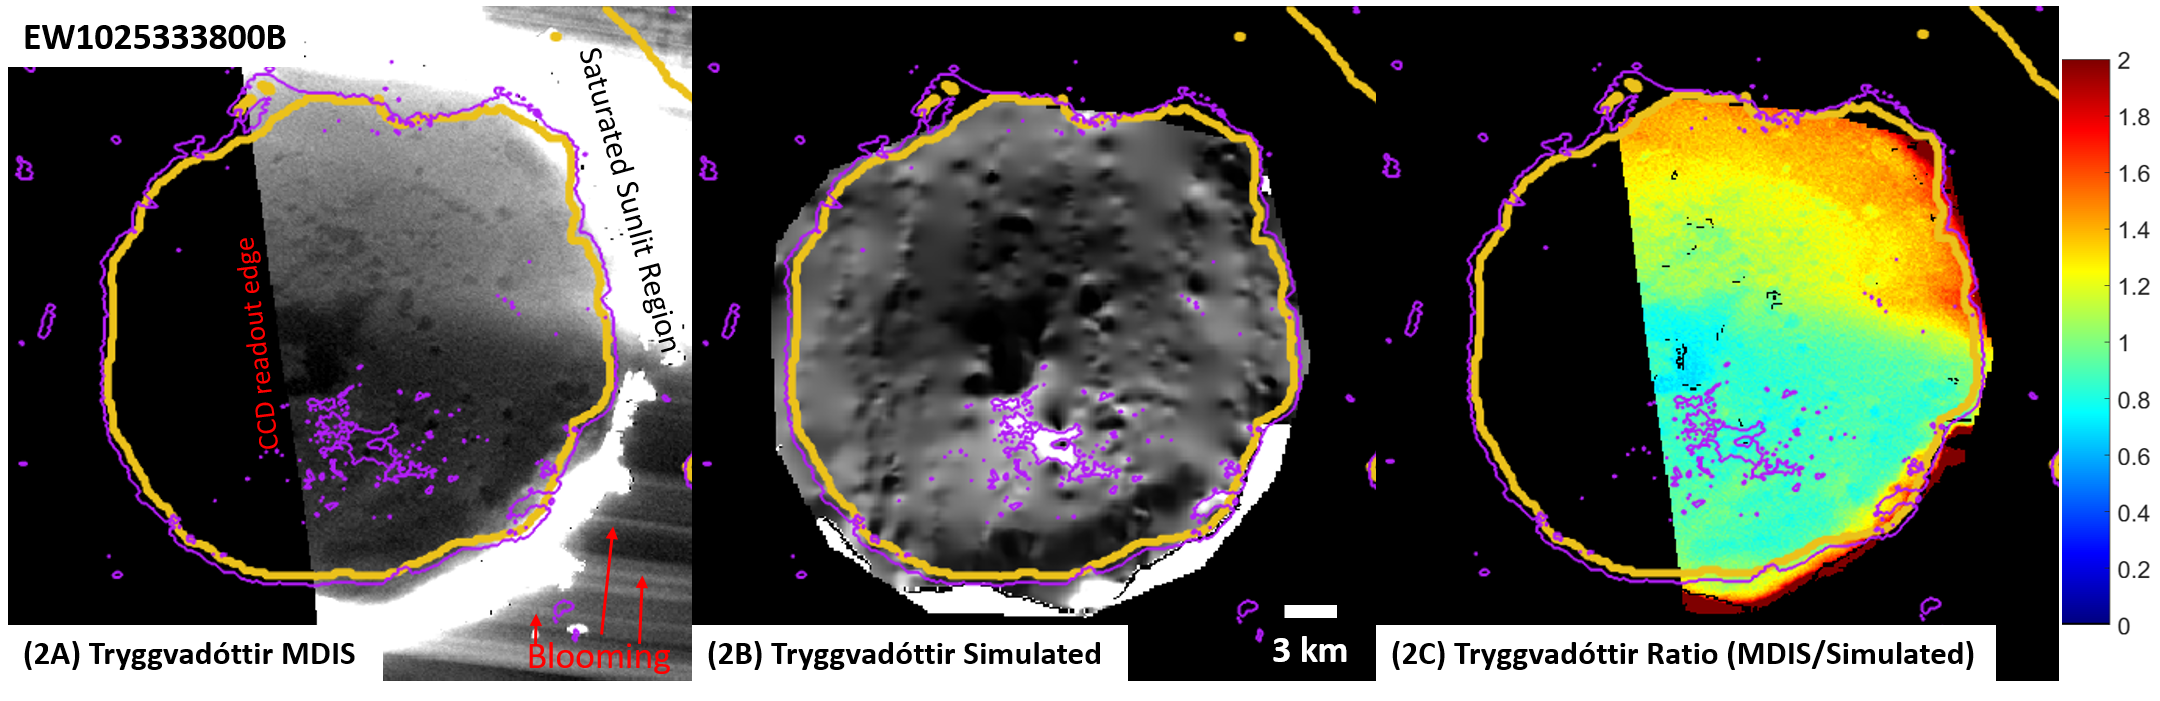
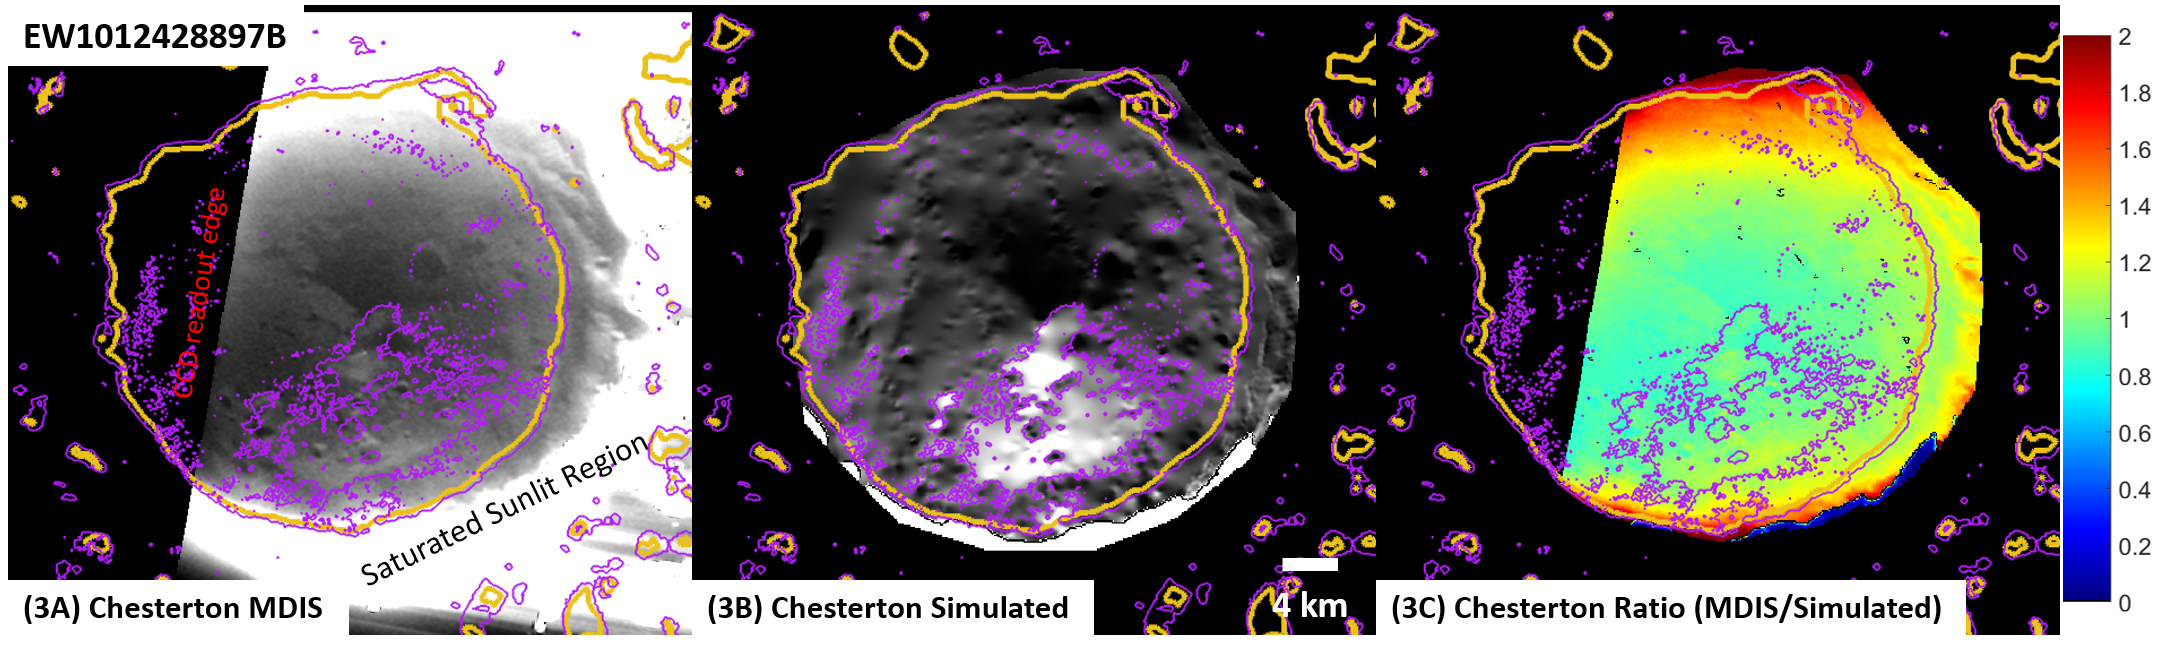
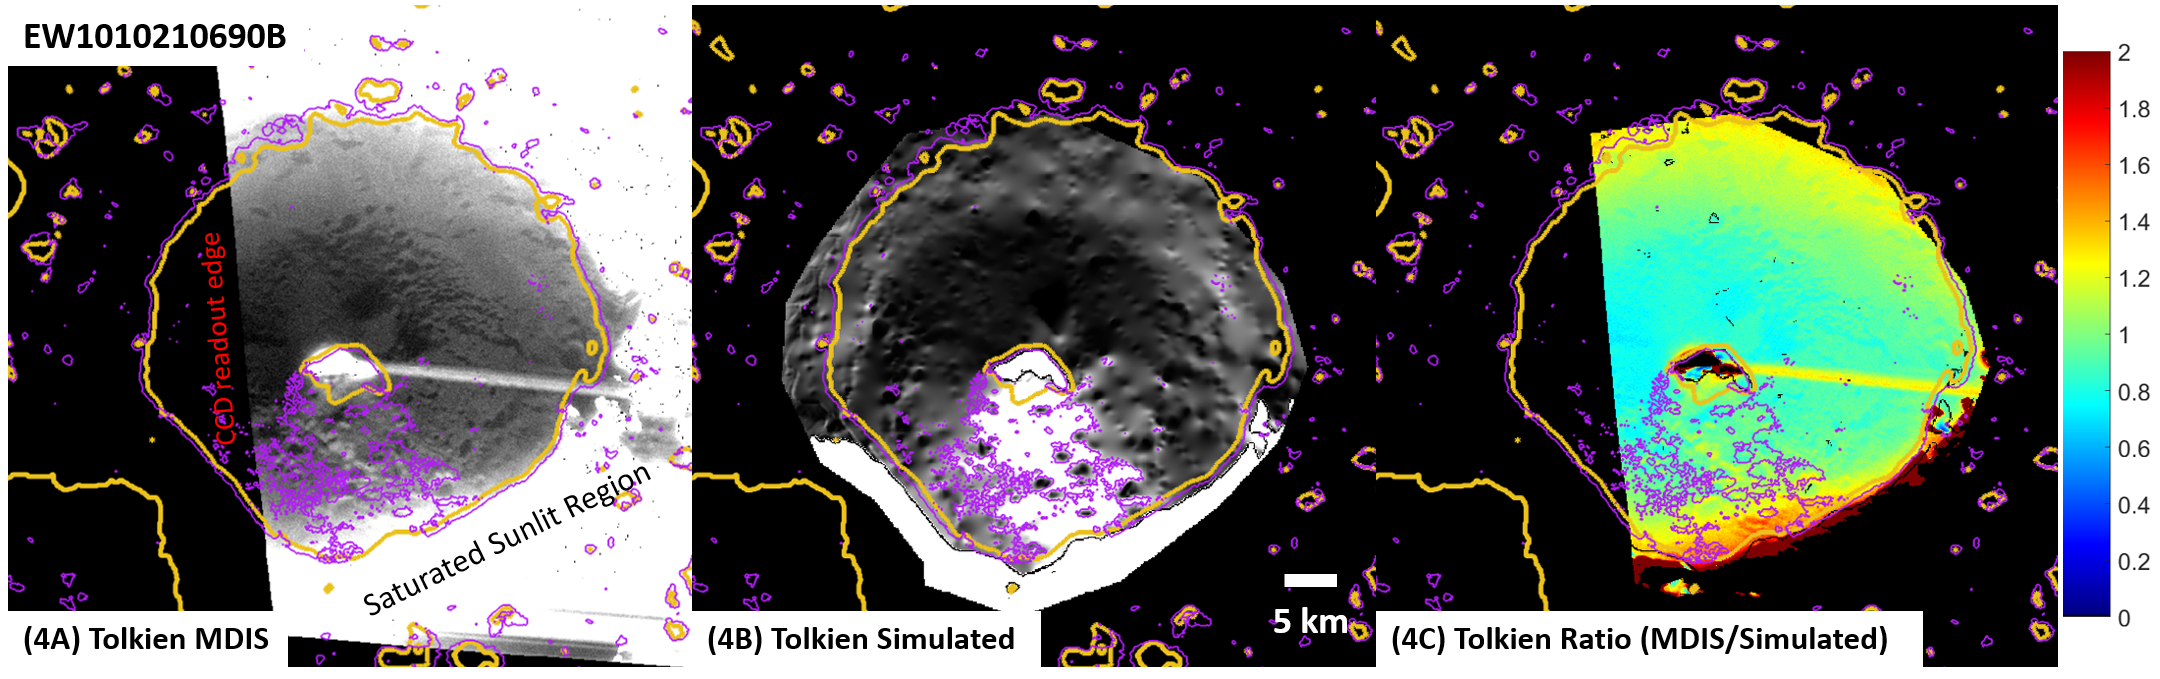
figure2.png |
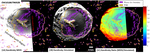
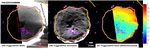
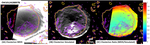
Prediction of surface composition in Kandinsky, Tolkien, Chesterton, and Tryggvadottir |
|
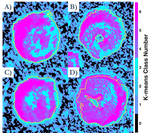
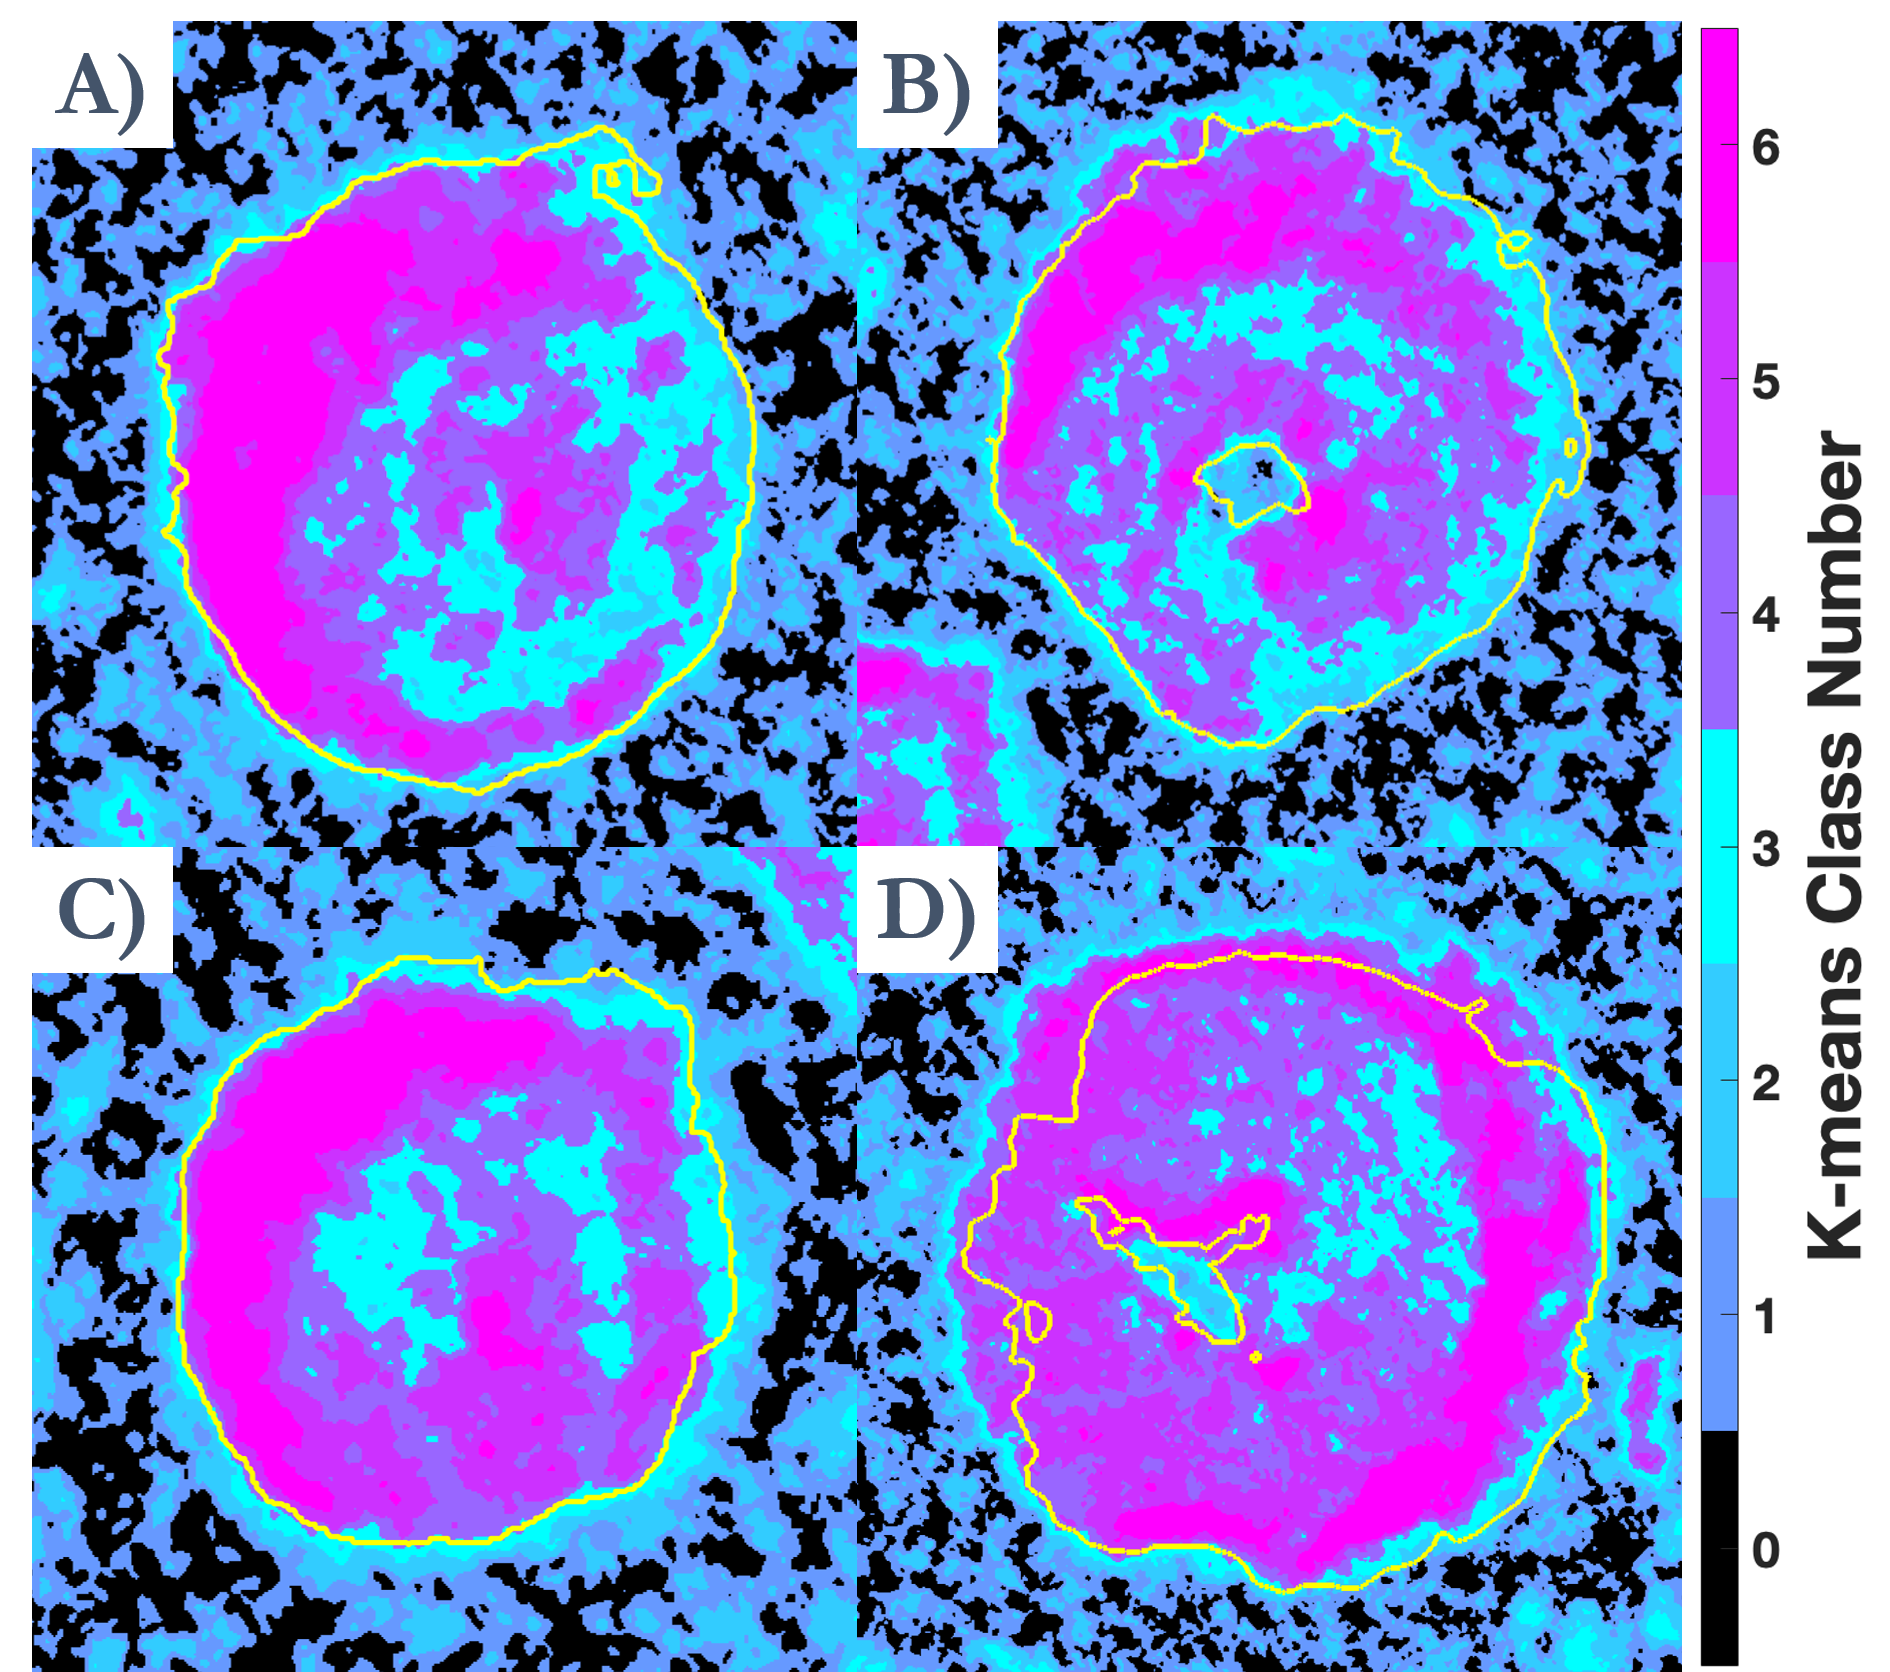
figure3.png |
K-means map of the radar backscatter over Kandinsky, Tolkien, Chesterton, and Tryggvadottir |
|
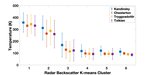
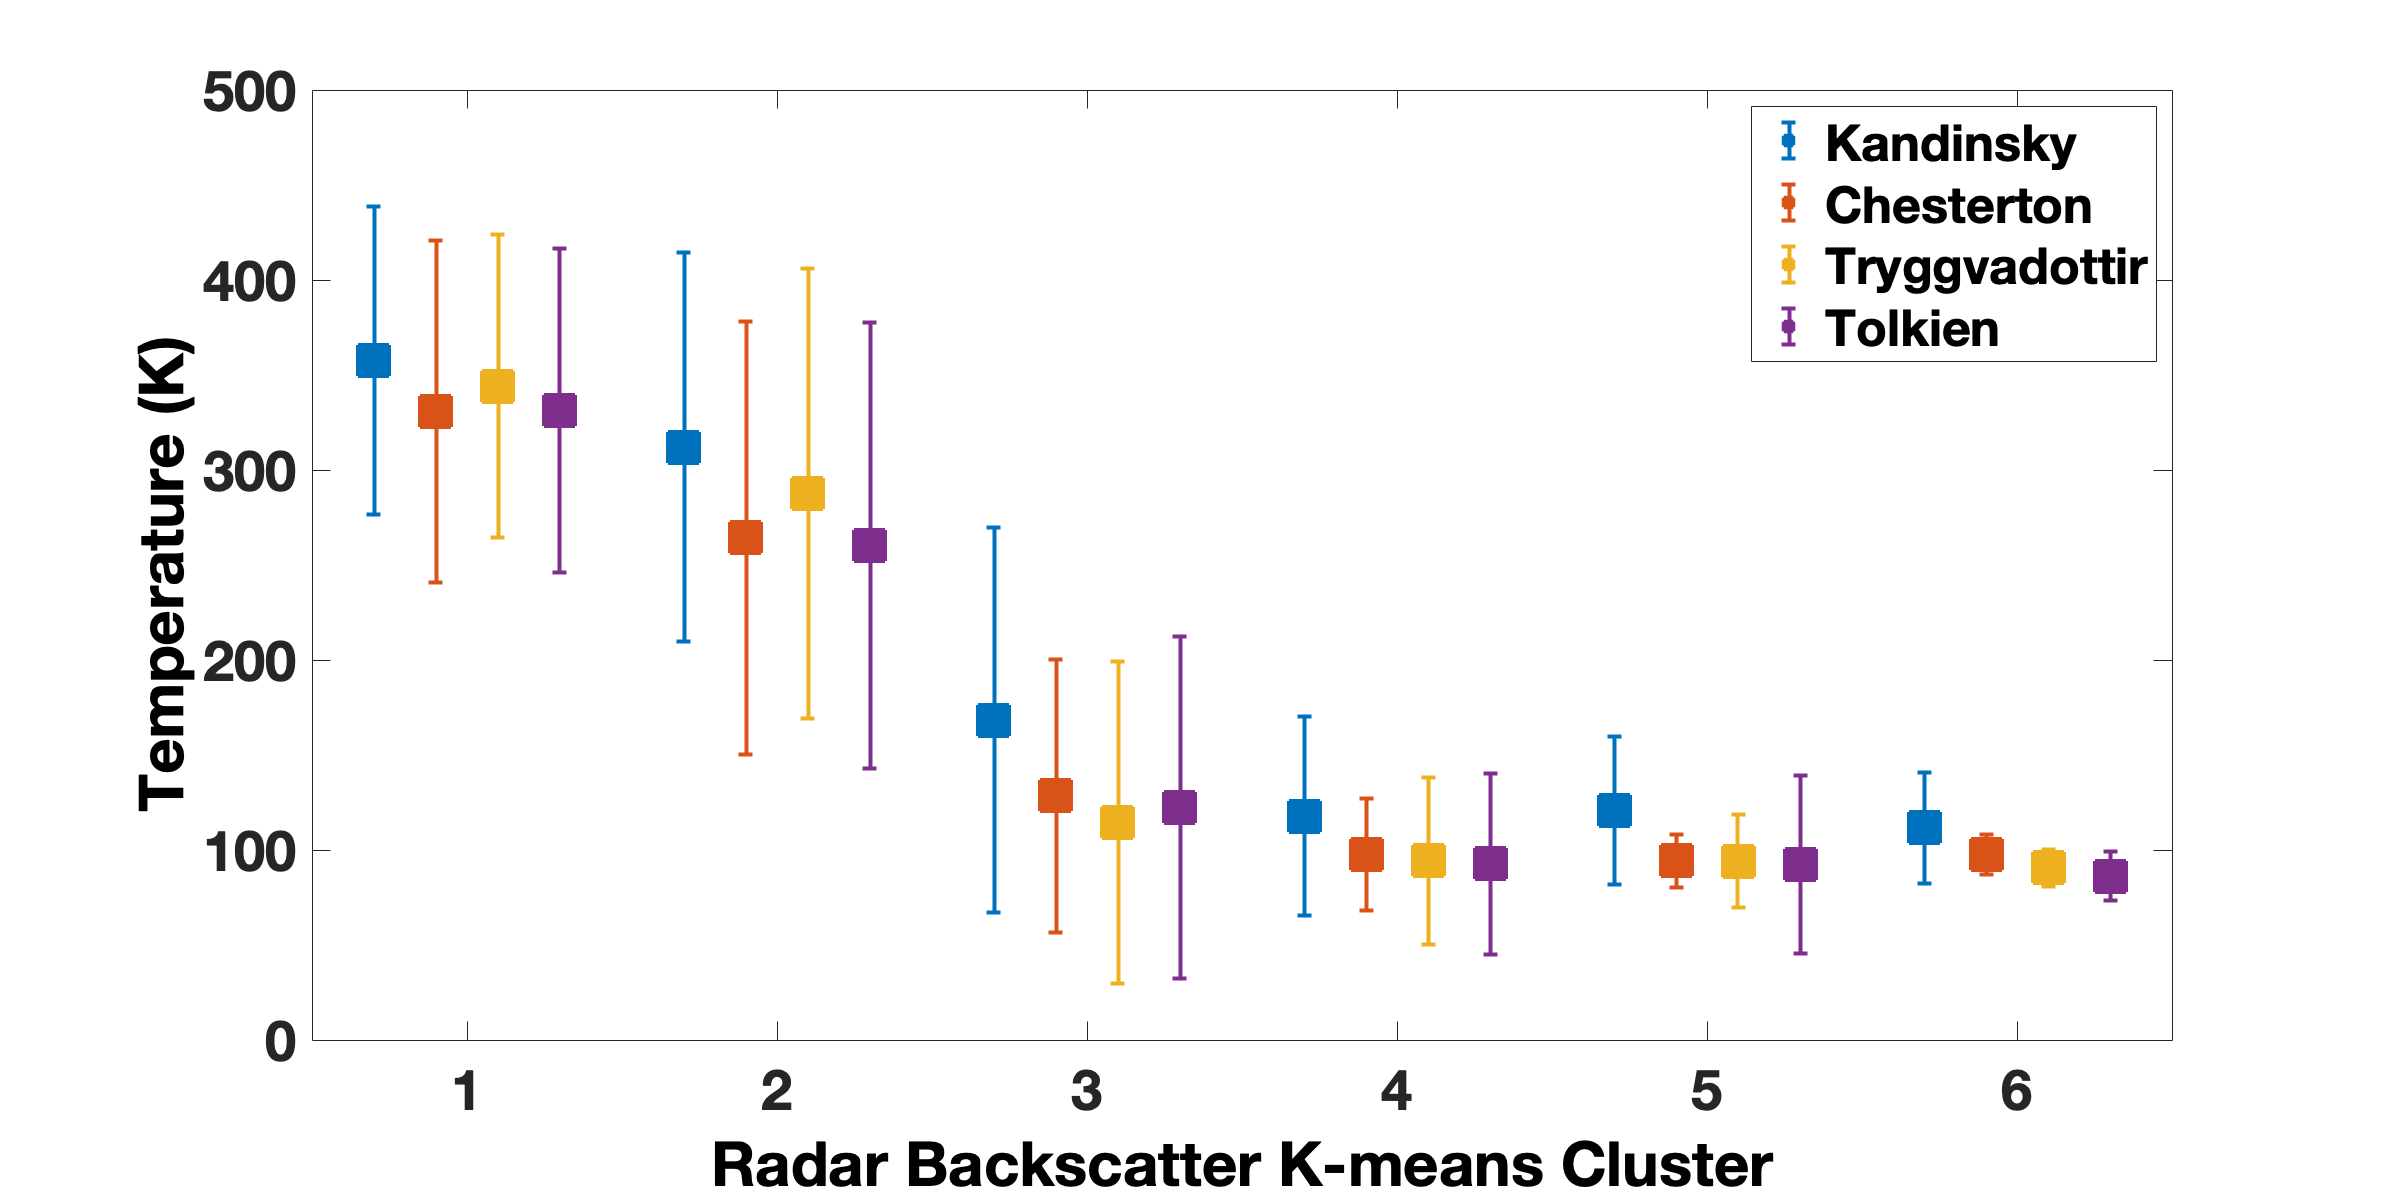
figure4.png |
Average modeled maximum temperatures vs radar backscatter clusters |
|
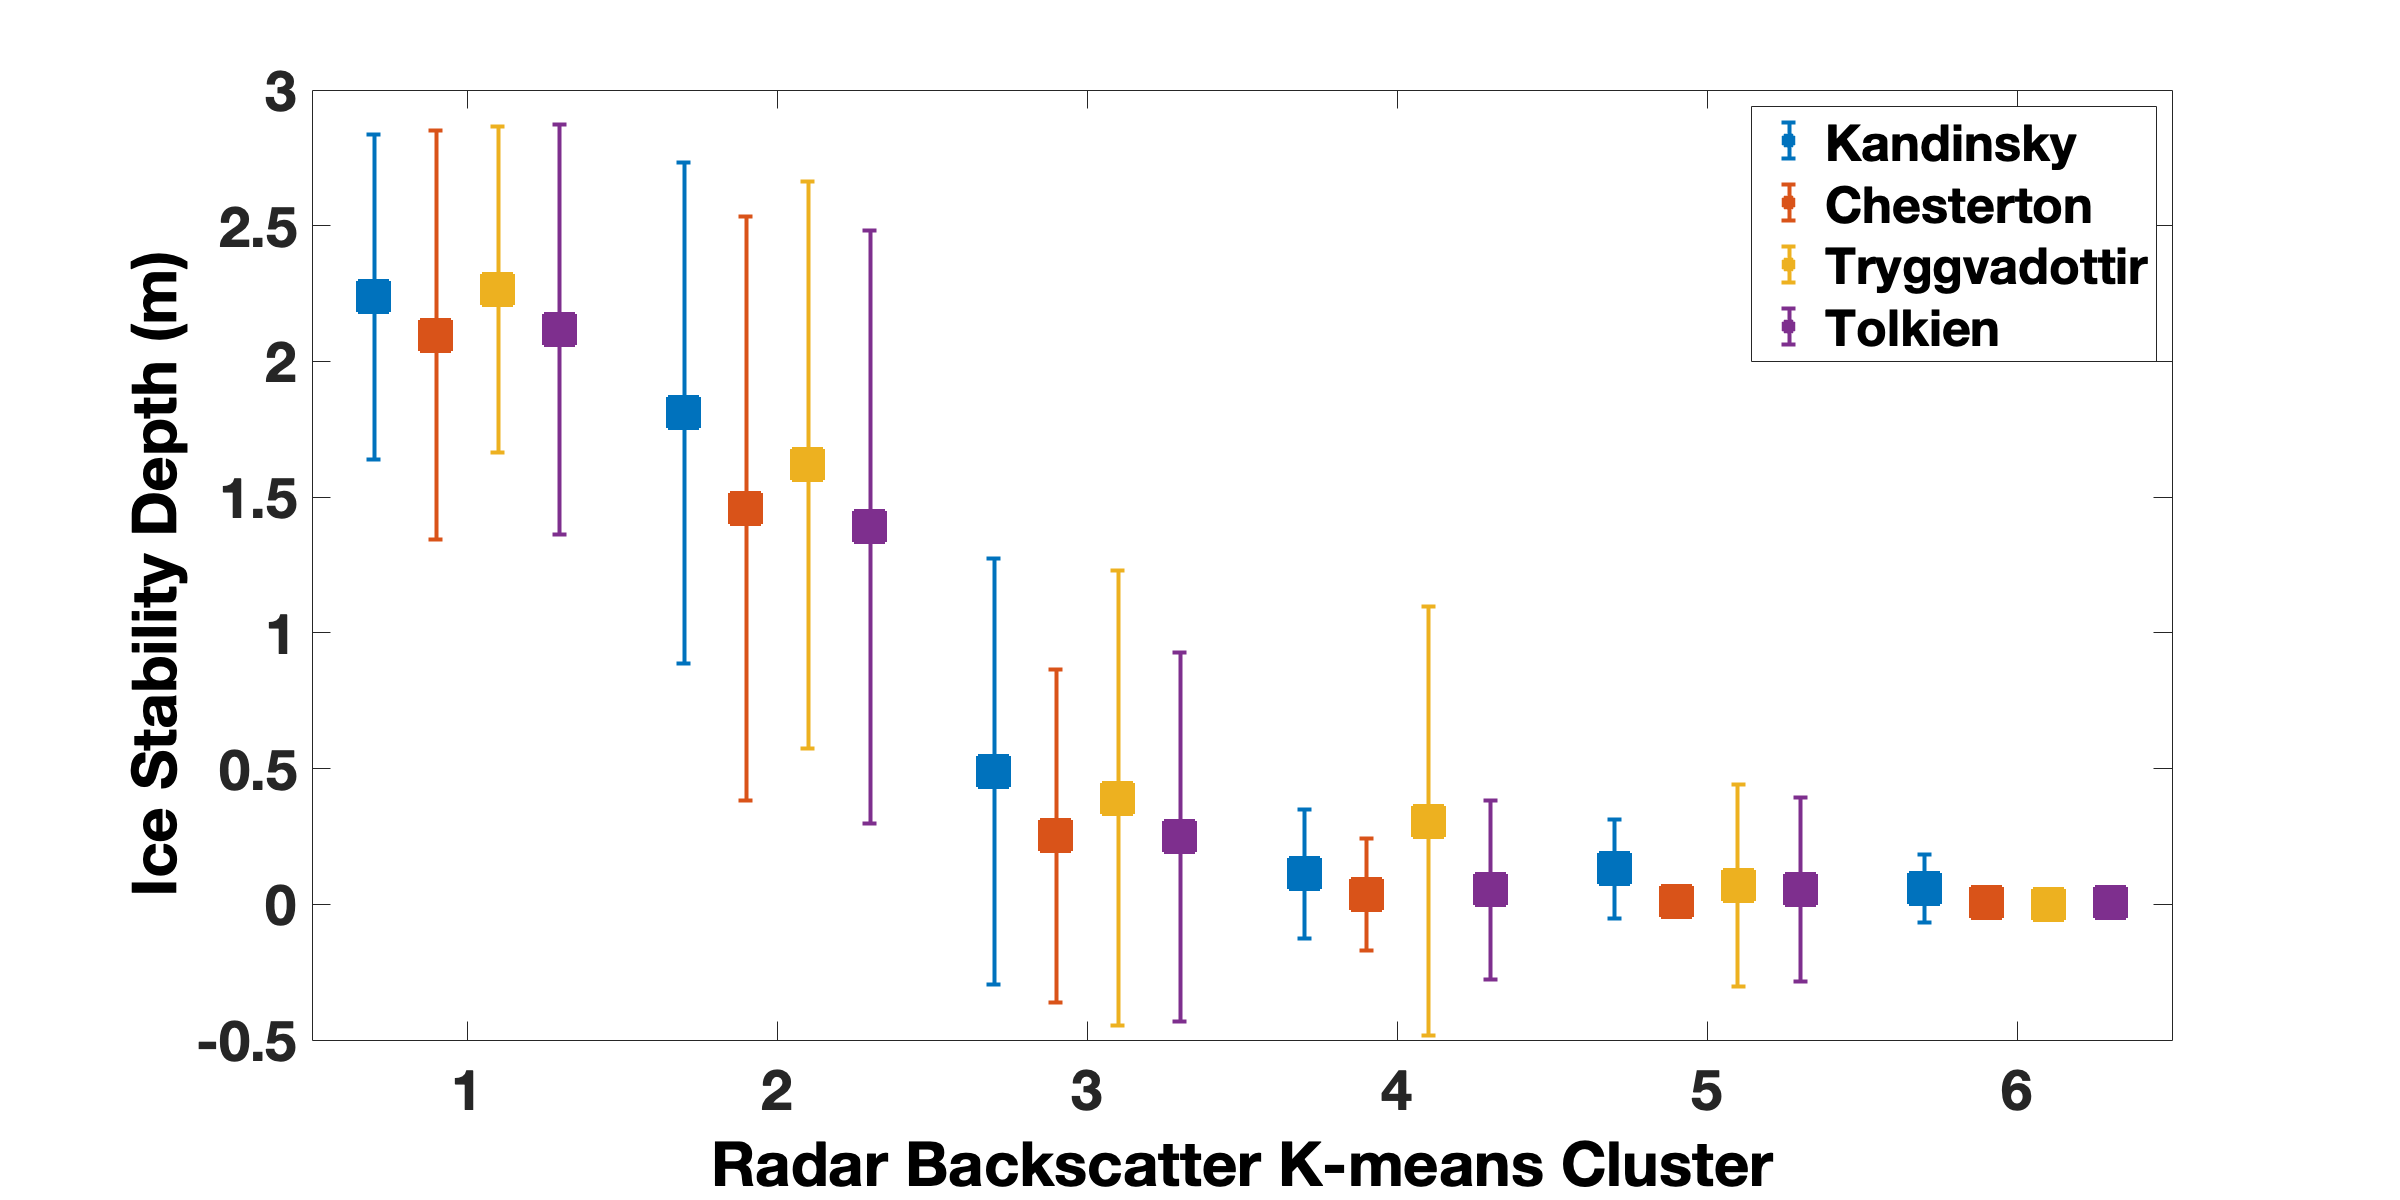
figure5.png |
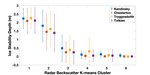
Average modeled ice stability depth vs radar backscatter clusters |
|
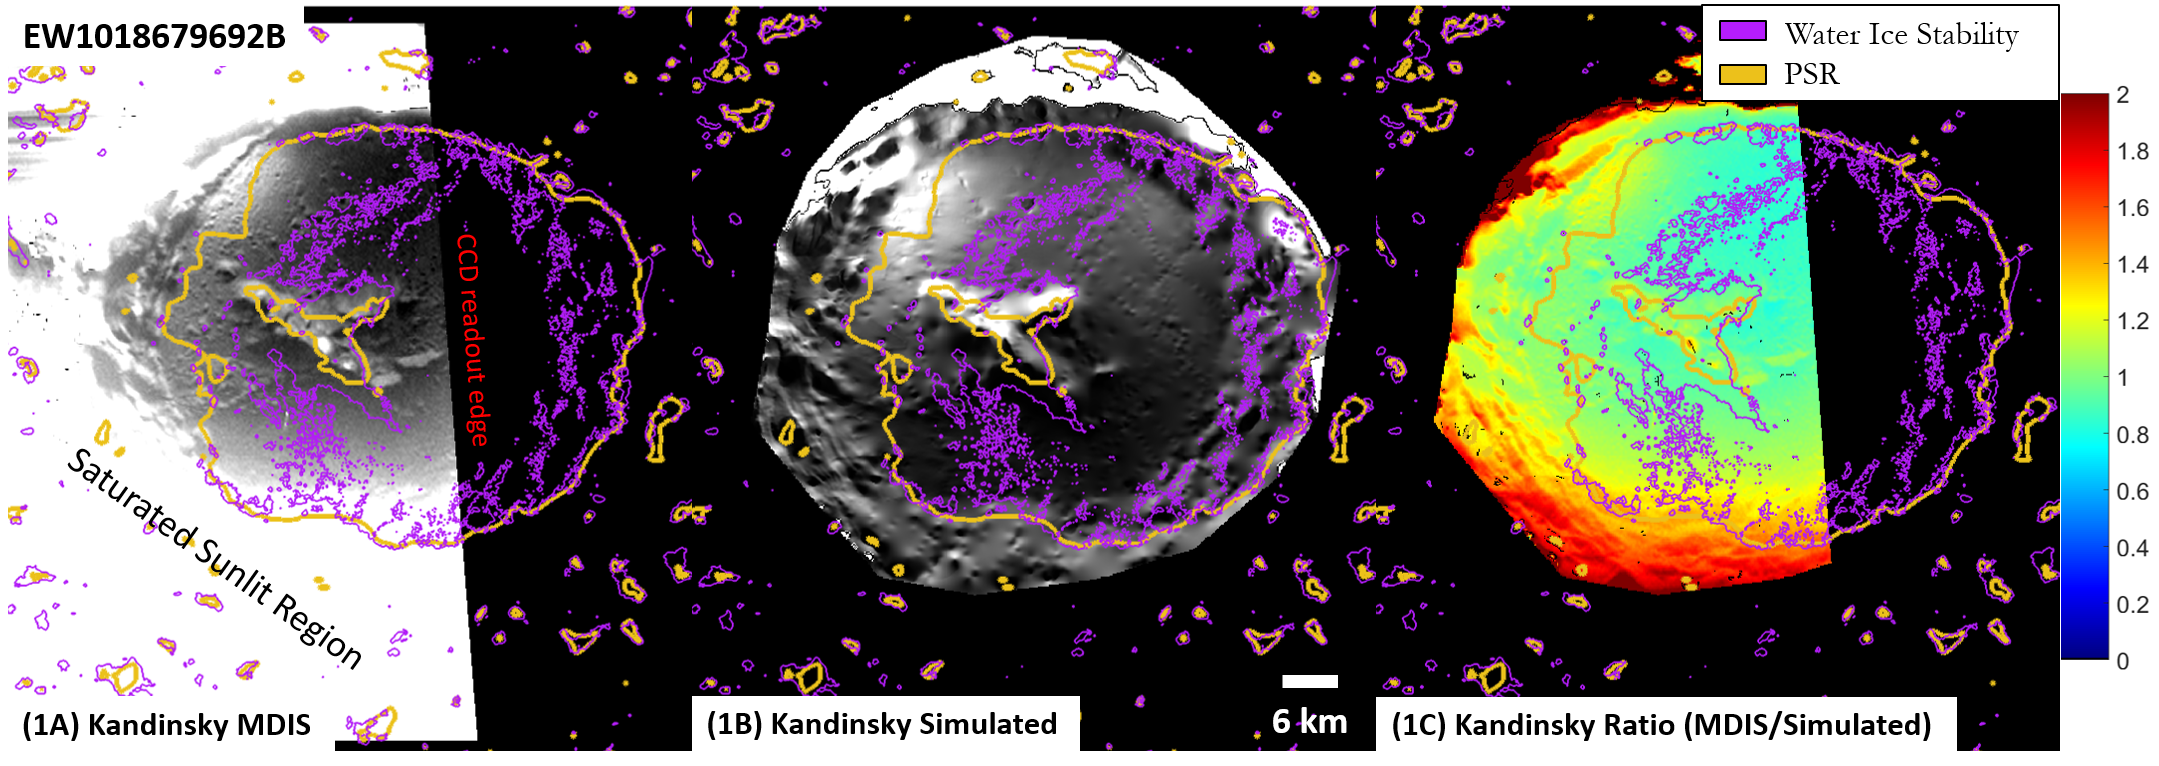
figure6_1abc.png |
MDIS, simulated, and ratio images for Kandinsky. MDIS ID: EW1018679692B |
|
figure6_2abc.png |
MDIS, simulated, and ratio images for Tryggvadottir. MDIS ID: EW1025333800B |
|
figure6_3abc.png |
MDIS, simulated, and ratio images for Chesterton. MDIS ID: EW1012428897B |
|
figure6_4abc.png |
MDIS, simulated, and ratio images for Tolkien. MDIS ID: EW1010210690B |
|
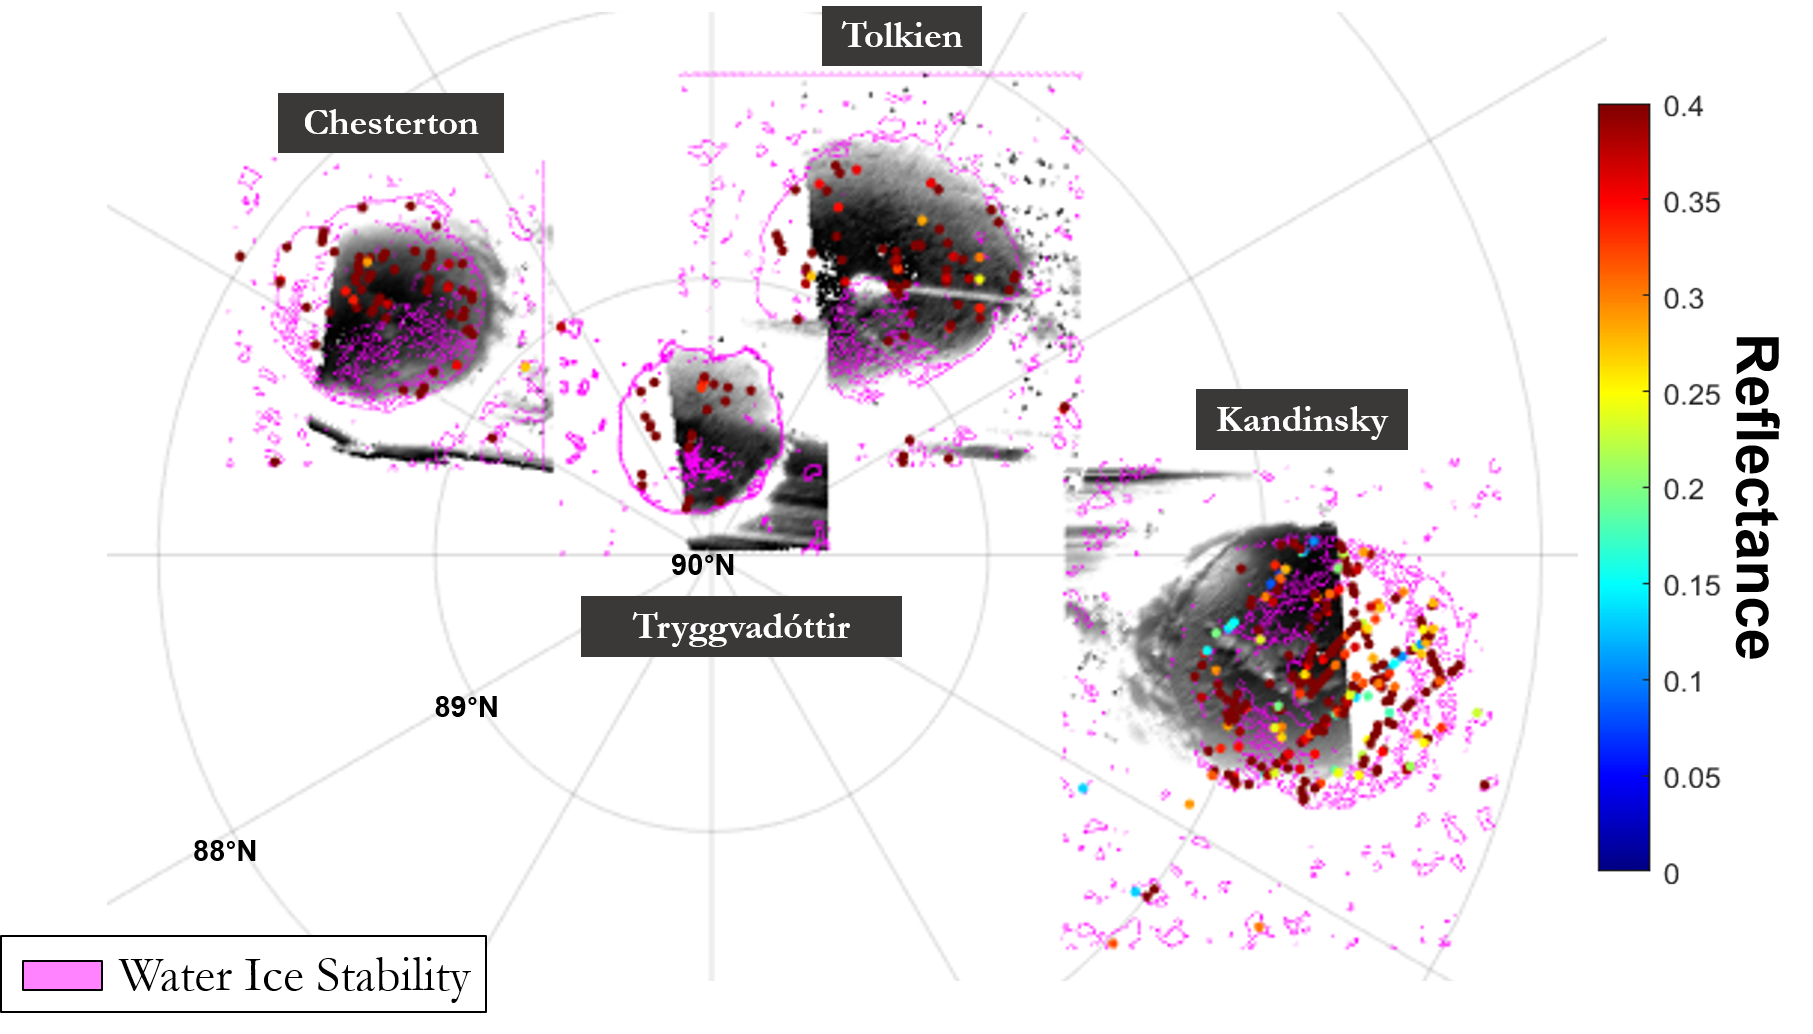
figure8.png |
MLA in the PSR of each crater mapped over MDIS from Fig. 6 |
|
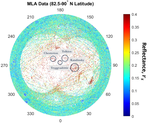
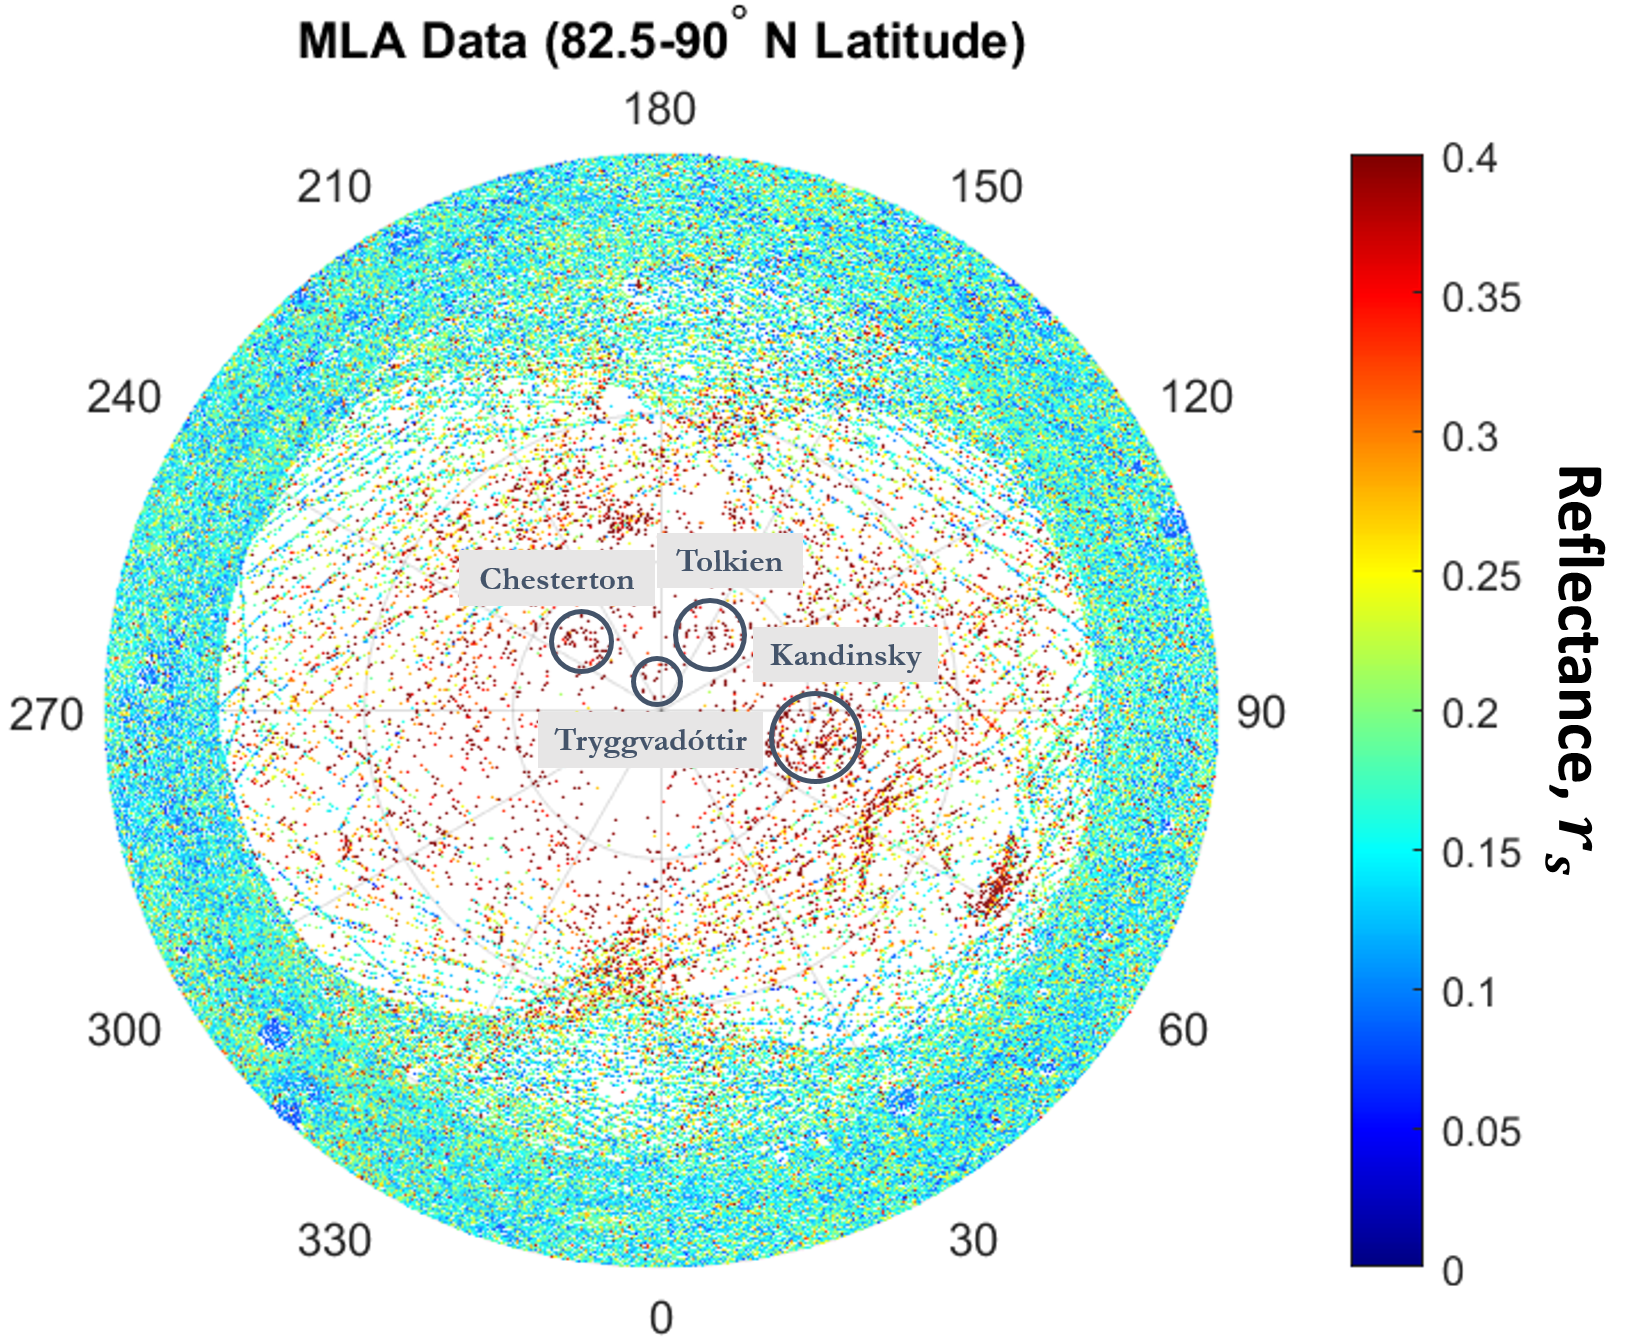
figure7.png |
All MLA data between 82.5-90 deg N latitude at pulse widths > 15 ns, ranges >100 m and <800 m, and emission angles <35 deg |
|
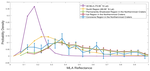
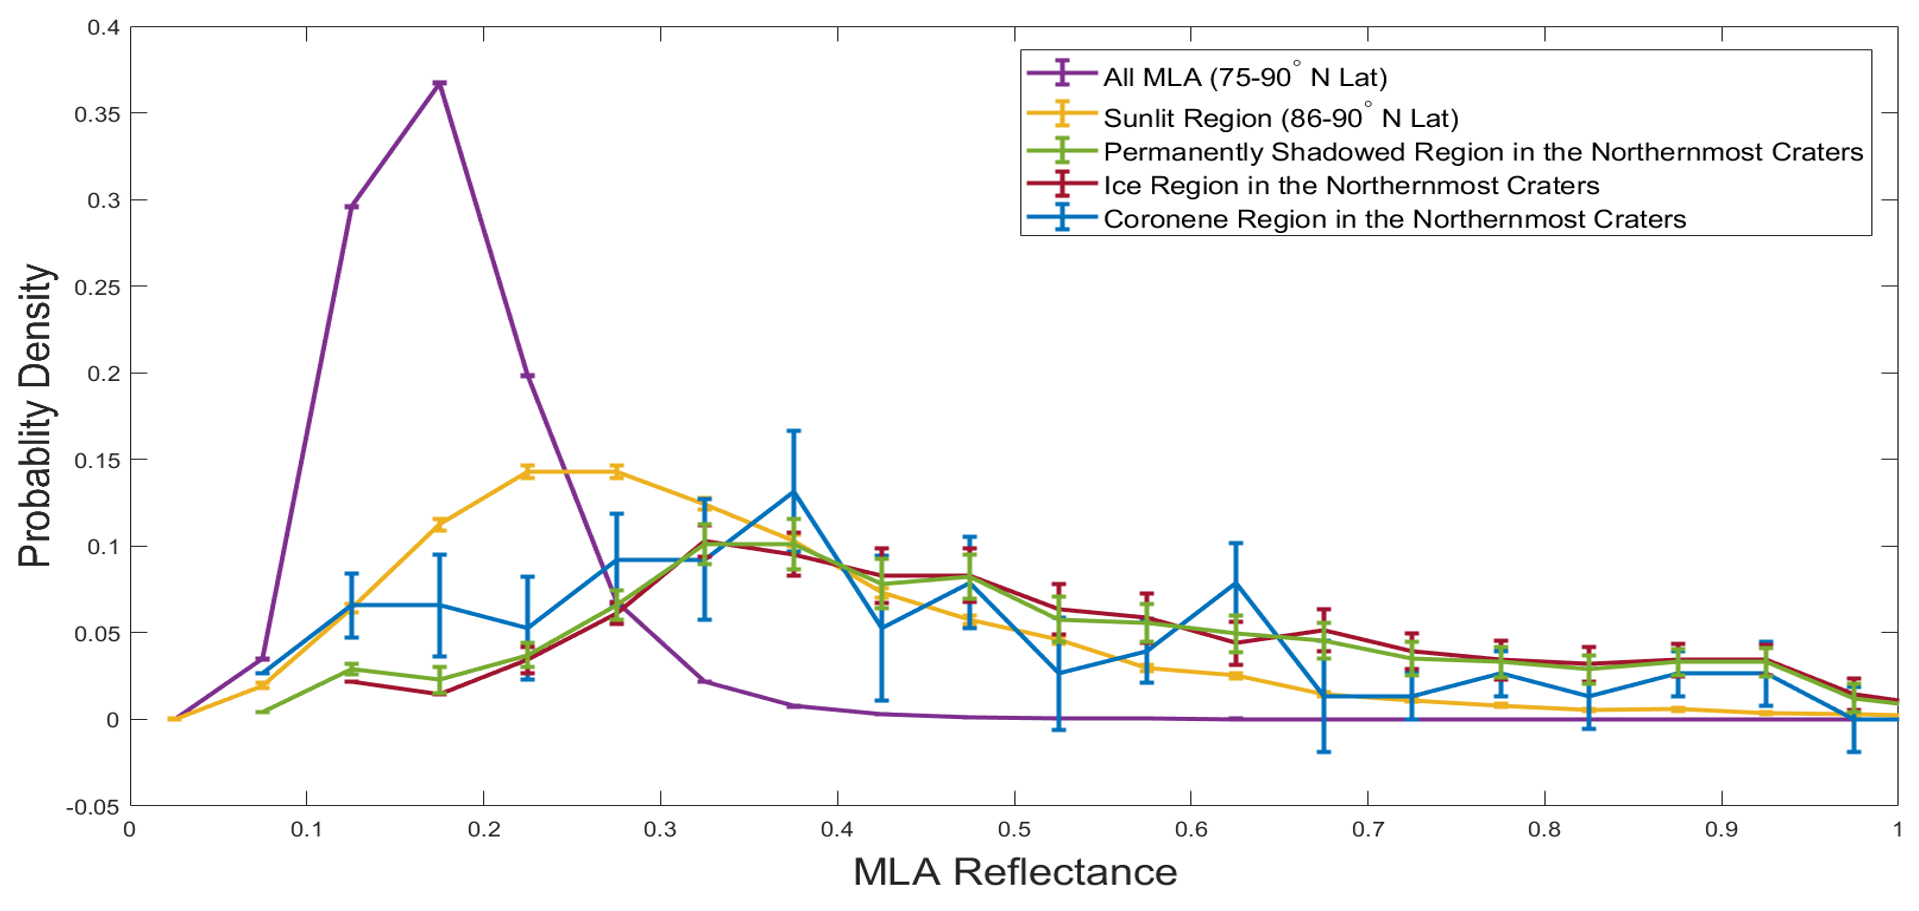
figure9.png |
Probability density as a function of MLA reflectance |
|
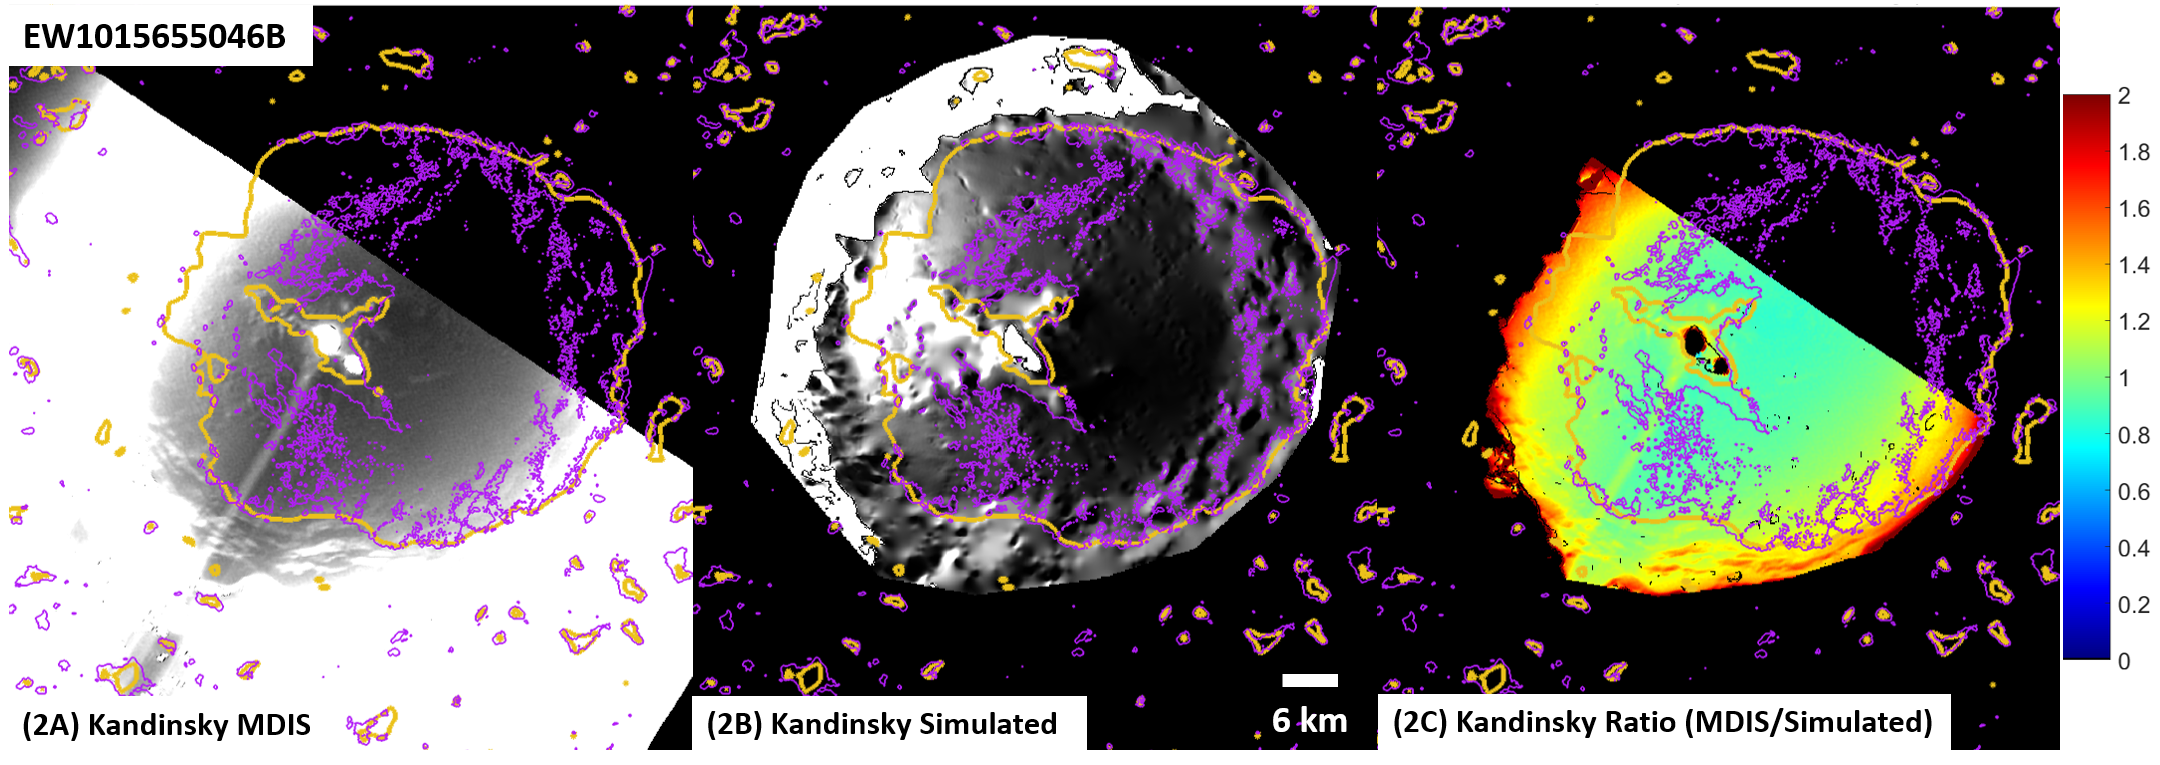
figure10_2abc.png |
MDIS, simulated, and ratio images for Kandinsky. MDIS ID: EW1015655046B |
|
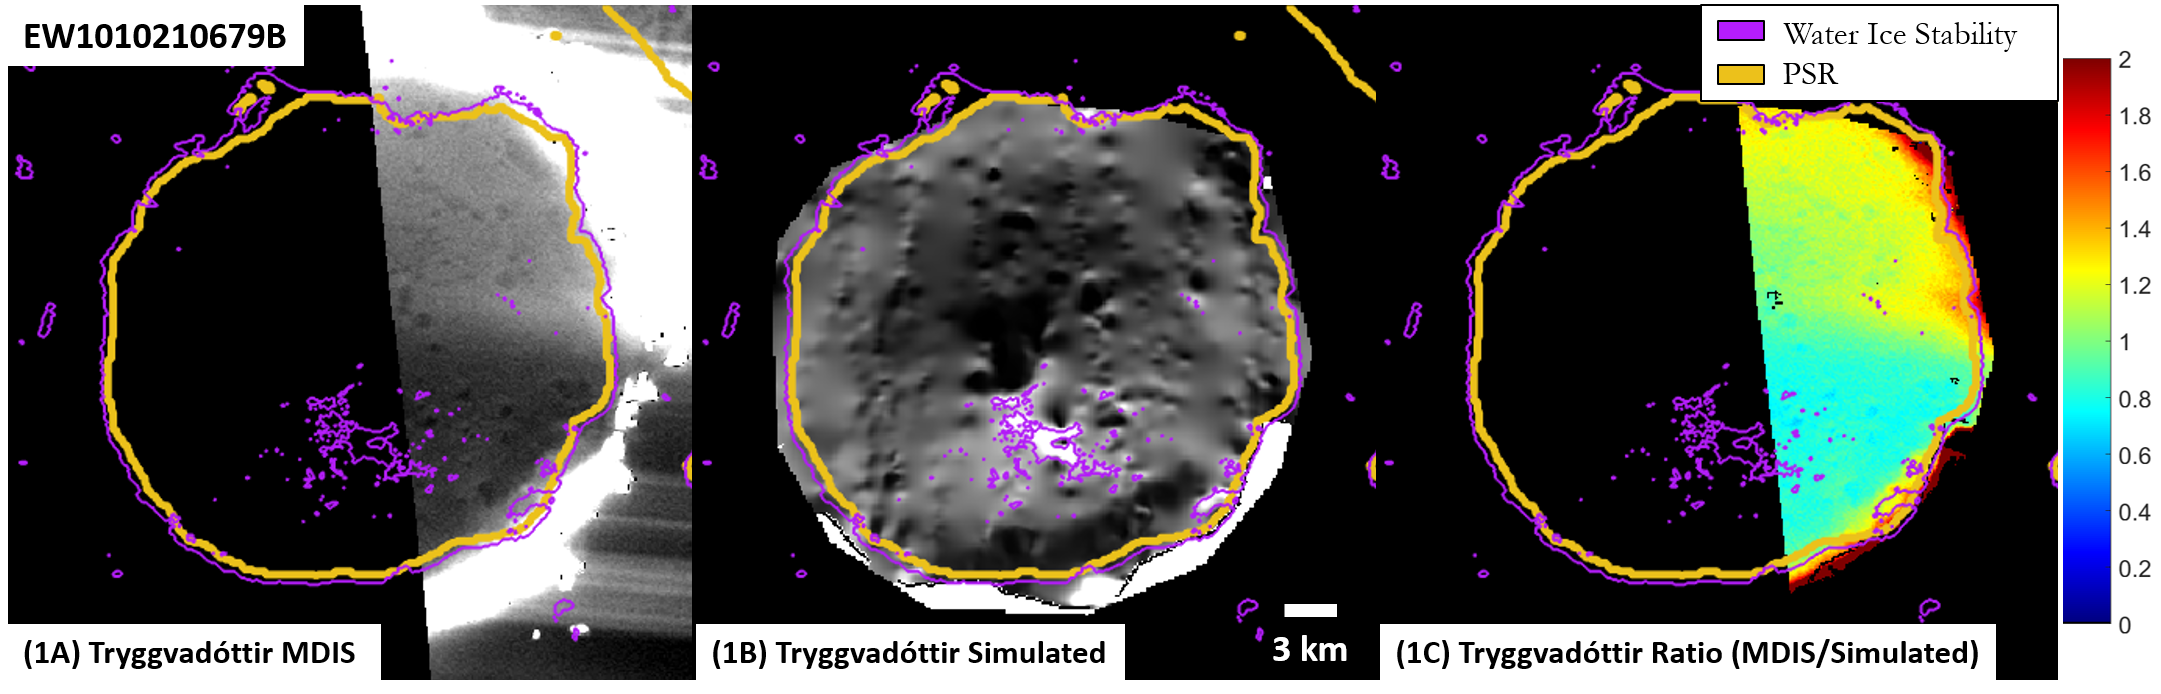
figure11_1abc.png |
MDIS, simulated, and ratio images for Tryggvadottir. MDIS ID: EW1010210679B |
|
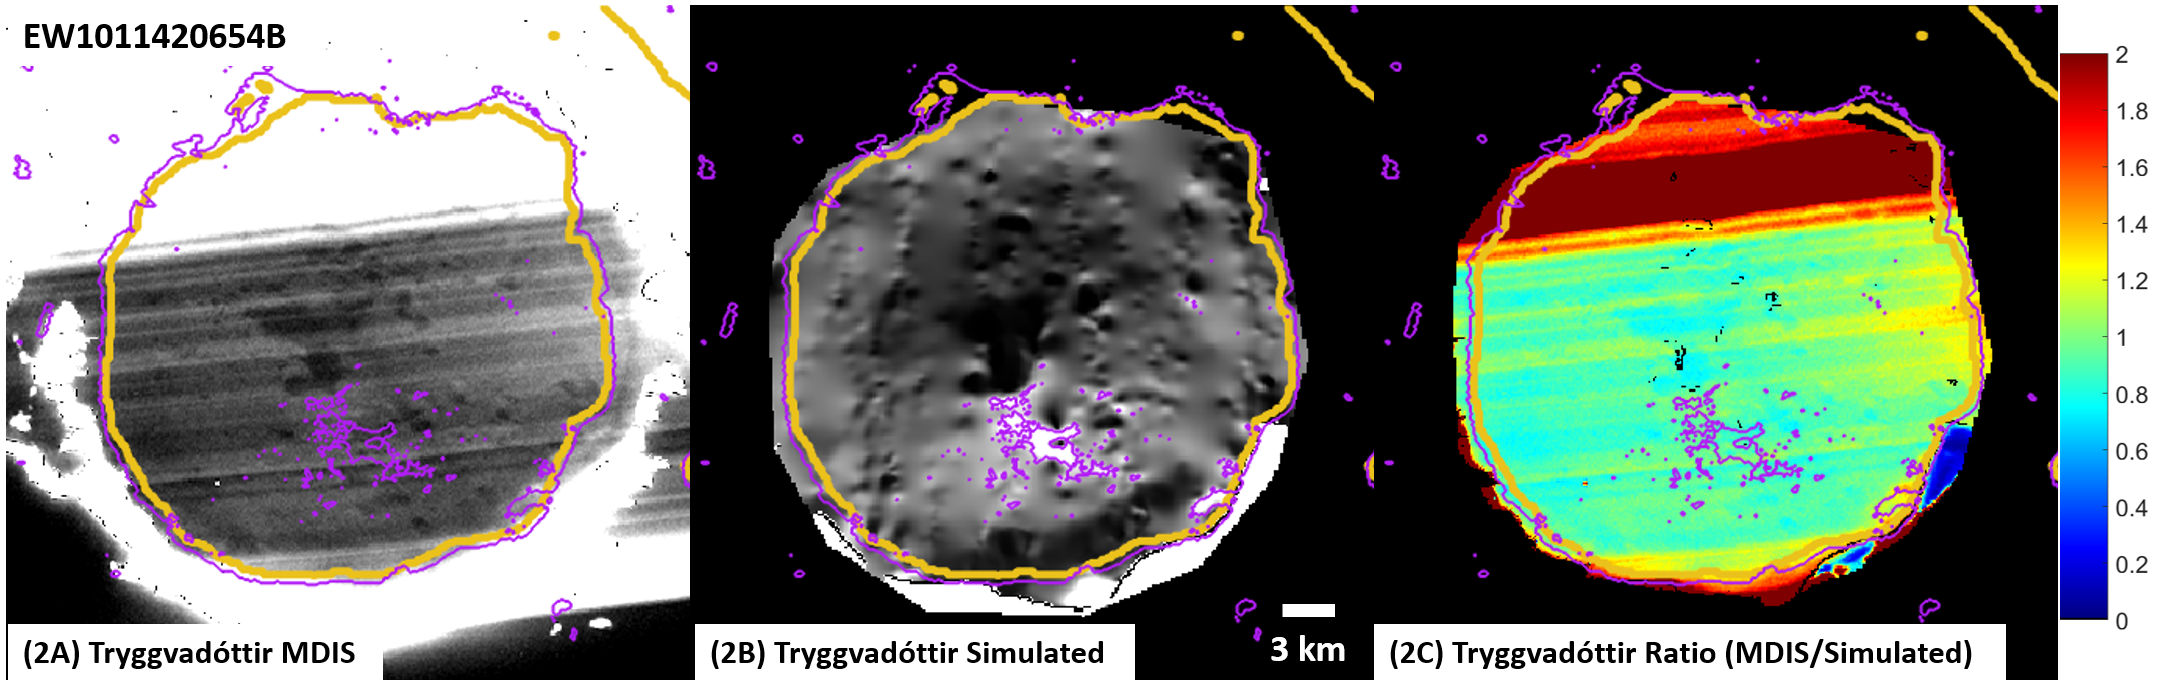
figure11_2abc.png |
MDIS, simulated, and ratio images for Tryggvadottir. MDIS ID: EW1011420654B |
|
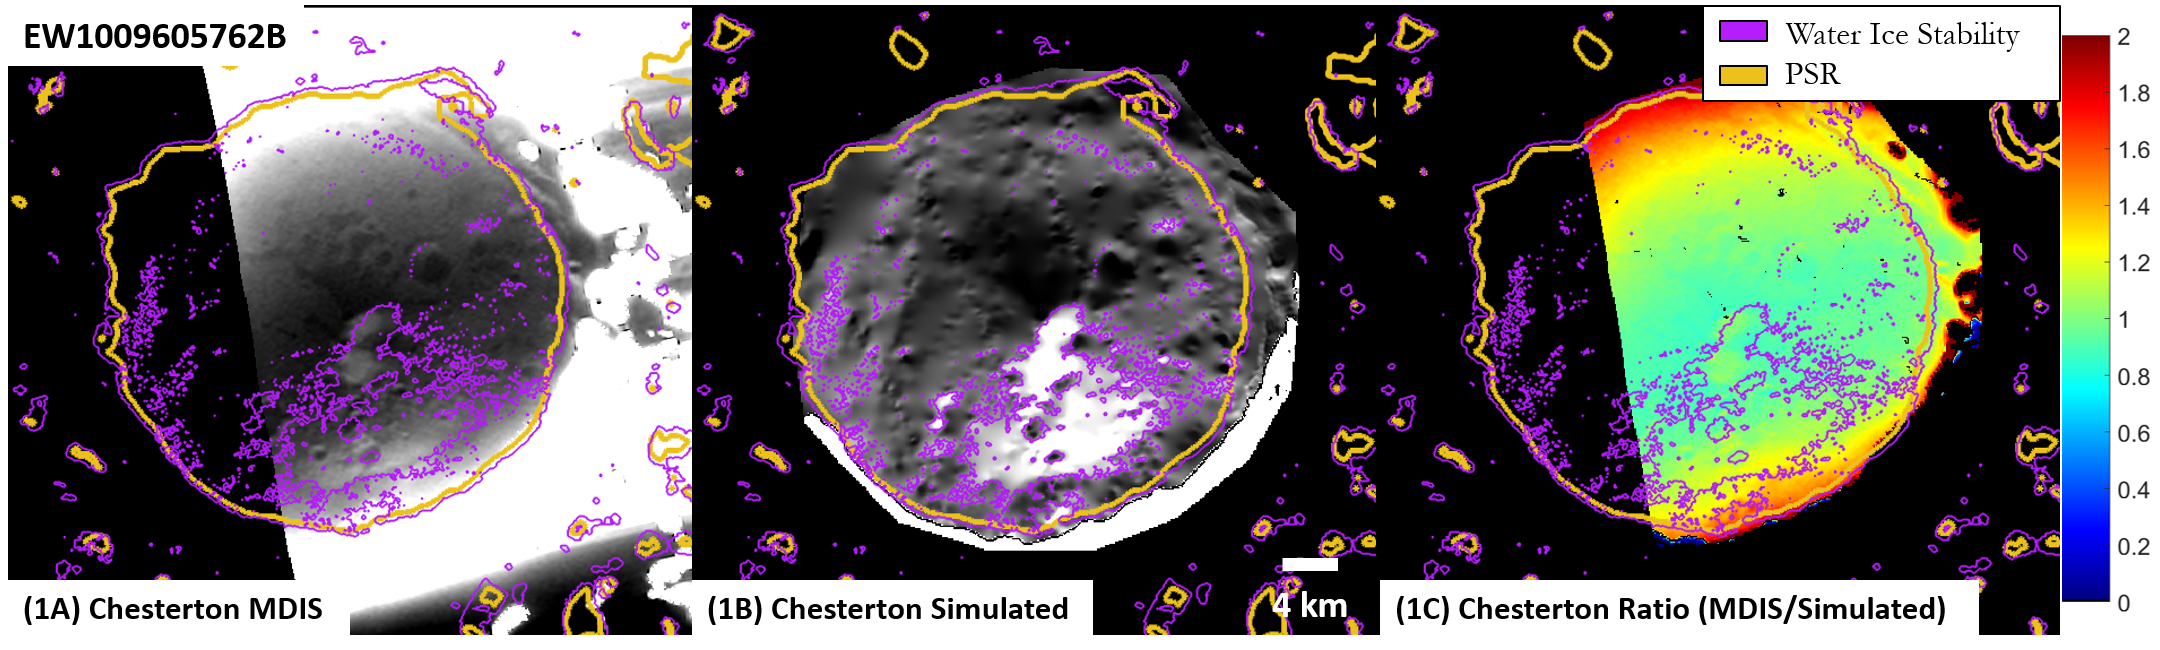
figure12_1abc.png |
MDIS, simulated, and ratio images for Chesterton. MDIS ID: EW1009605762B |

|
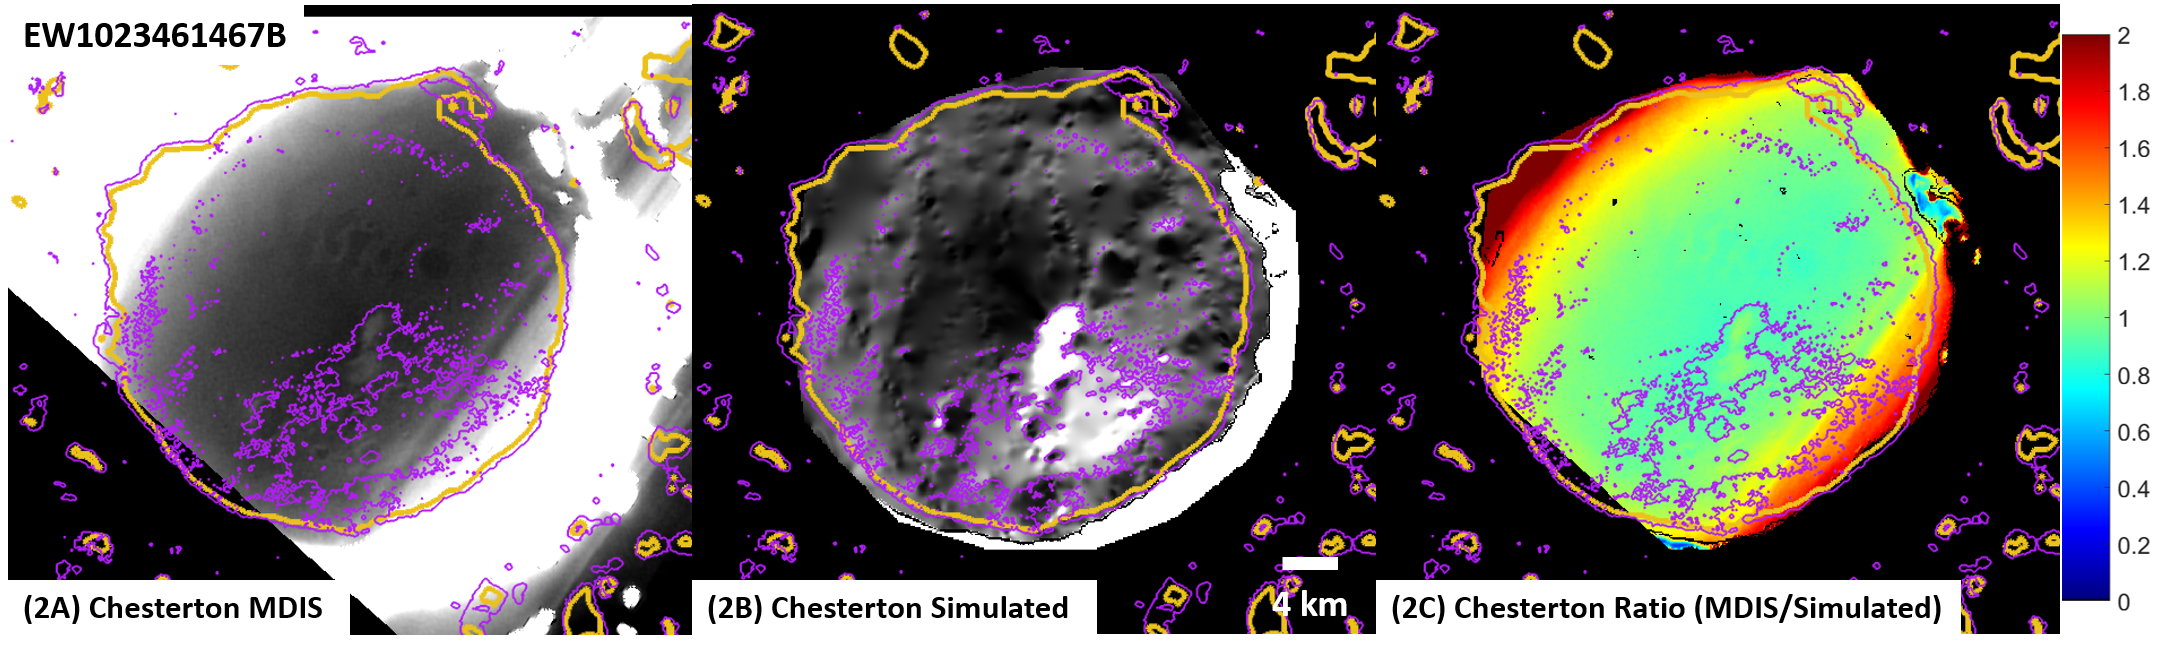
figure12_2abc.png |
MDIS, simulated, and ratio images for Chesterton. MDIS ID: EW1023461467B |
|
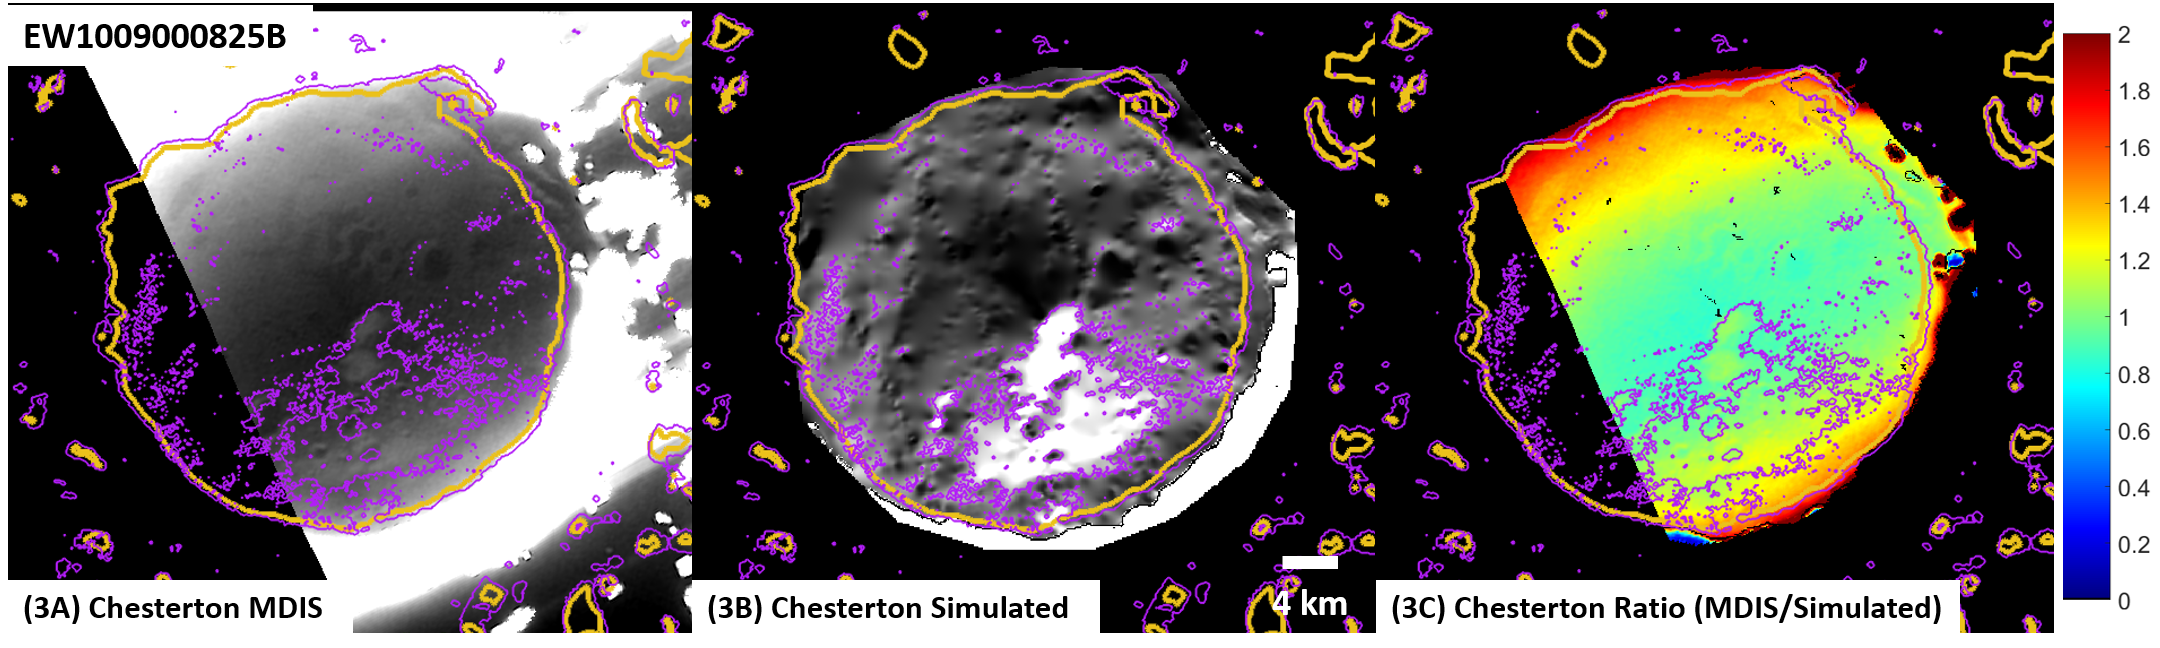
figure12_3abc.png |
MDIS, simulated, and ratio images for Chesterton. MDIS ID: EW1009000825B |
|
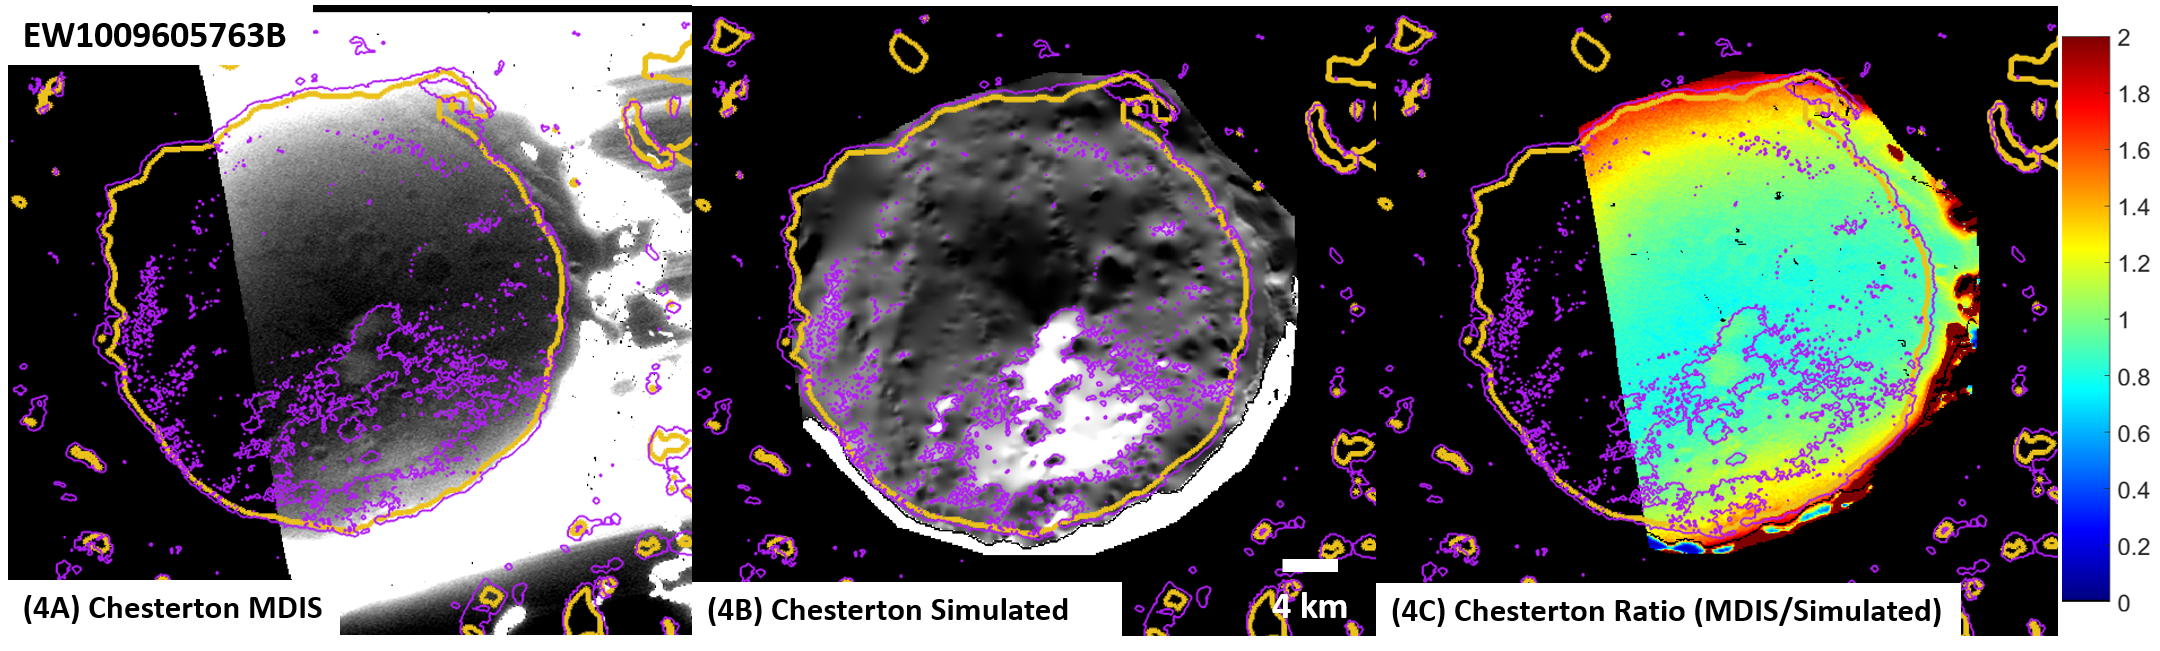
figure12_4abc.png |
MDIS, simulated, and ratio images for Chesterton. MDIS ID: EW1009605763B |
|
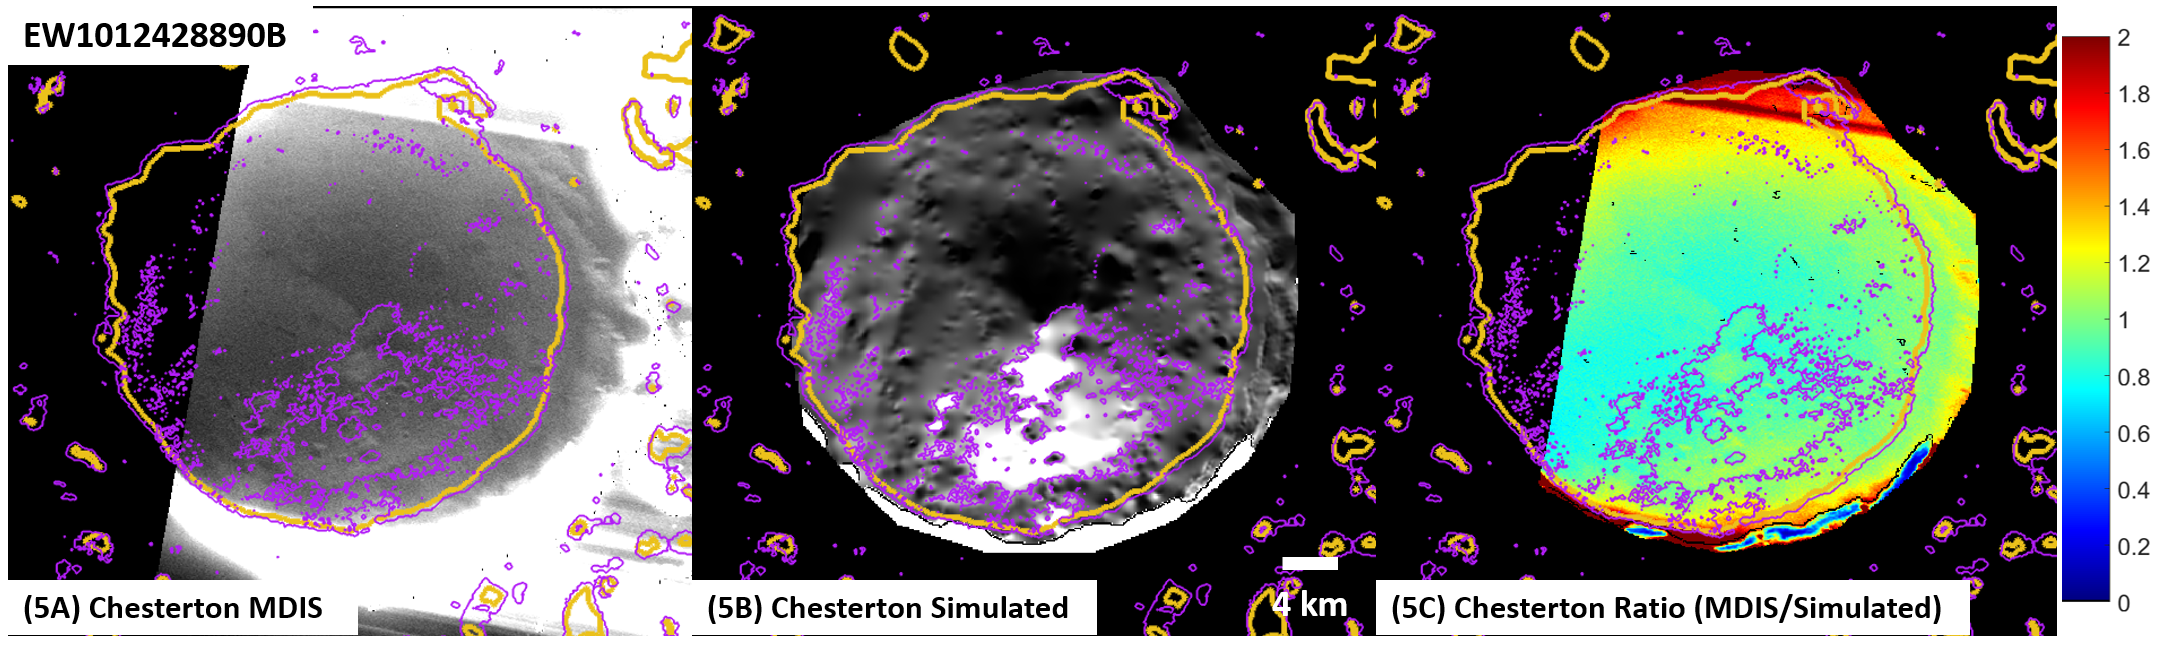
figure12_5abc.png |
MDIS, simulated, and ratio images for Chesterton. MDIS ID: EW1012428890B |
|
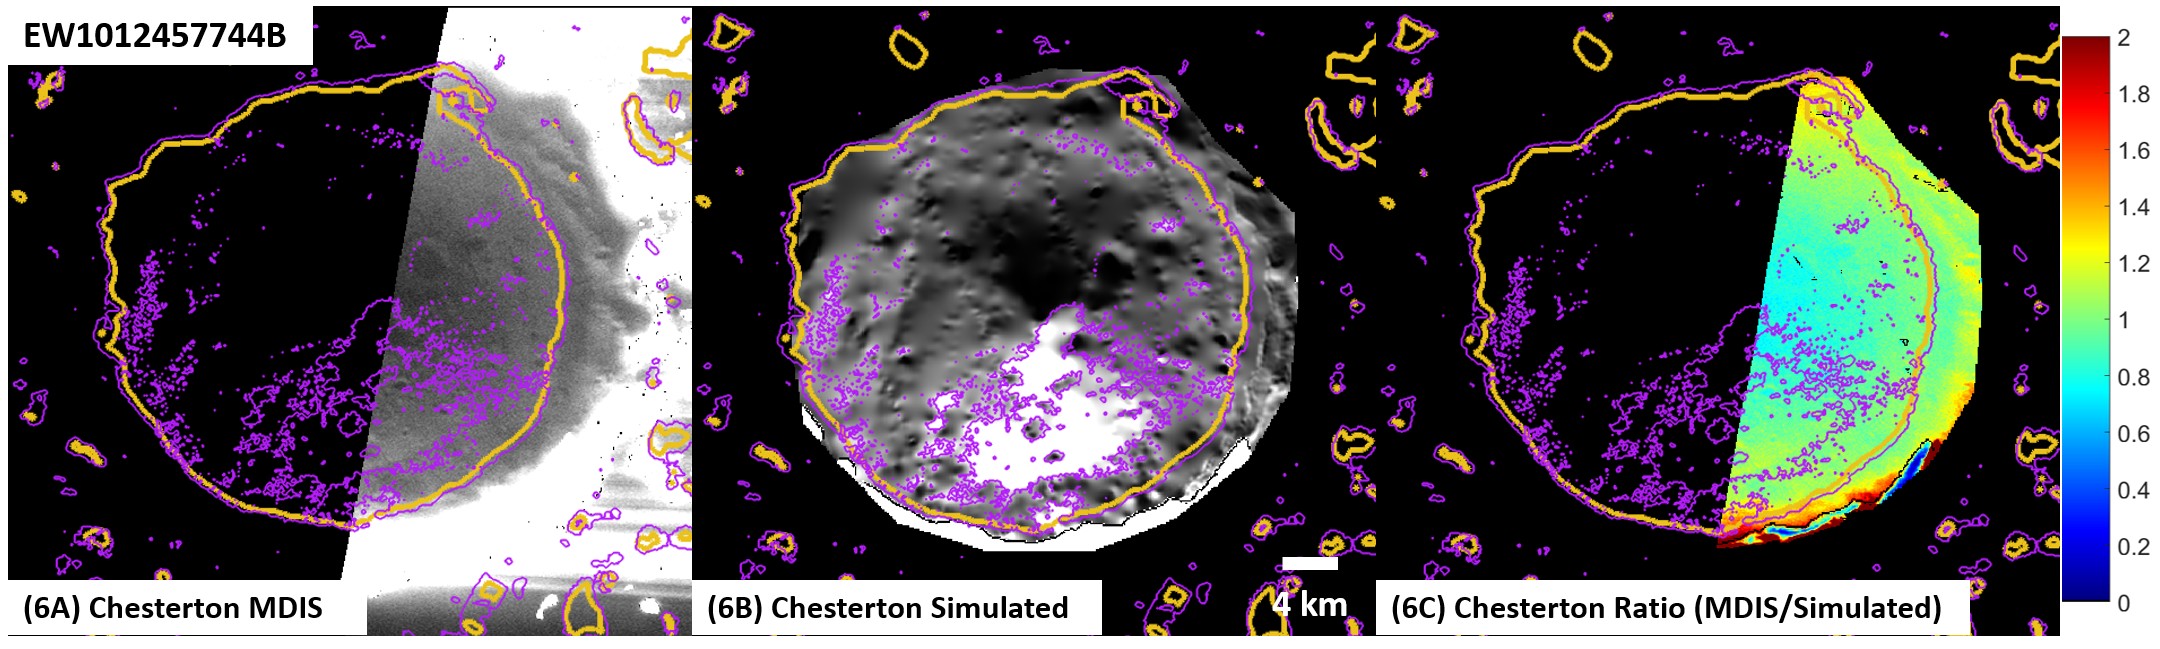
figure12_6abc.png |
MDIS, simulated, and ratio images for Chesterton. MDIS ID: EW1012457744B |
|
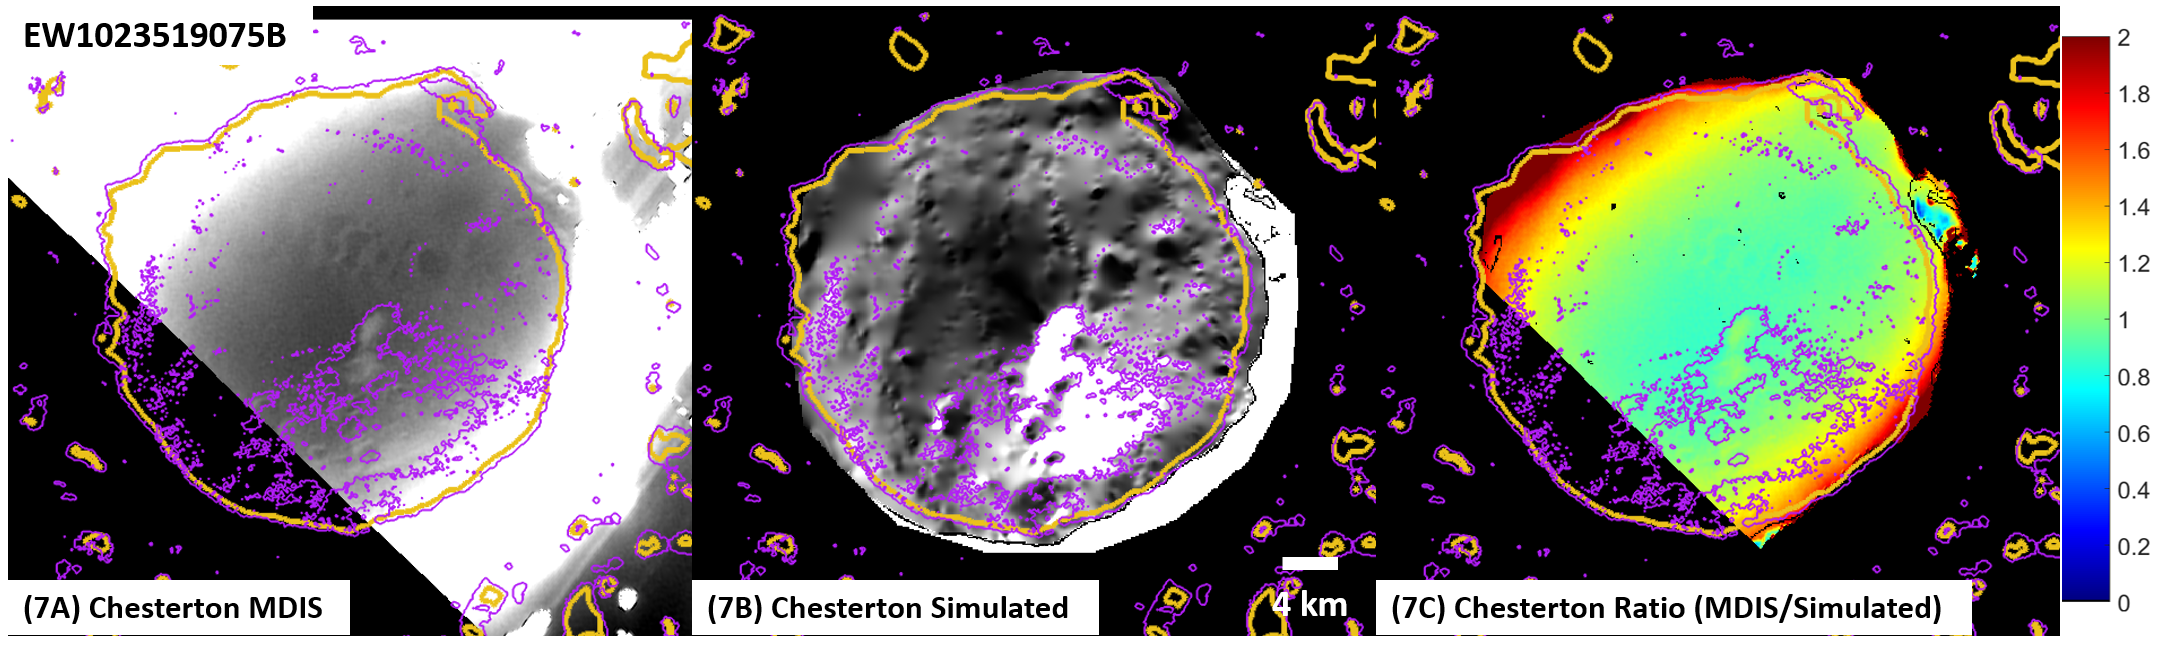
figure12_7abc.png |
MDIS, simulated, and ratio images for Chesterton. MDIS ID: EW10123519075B |
|
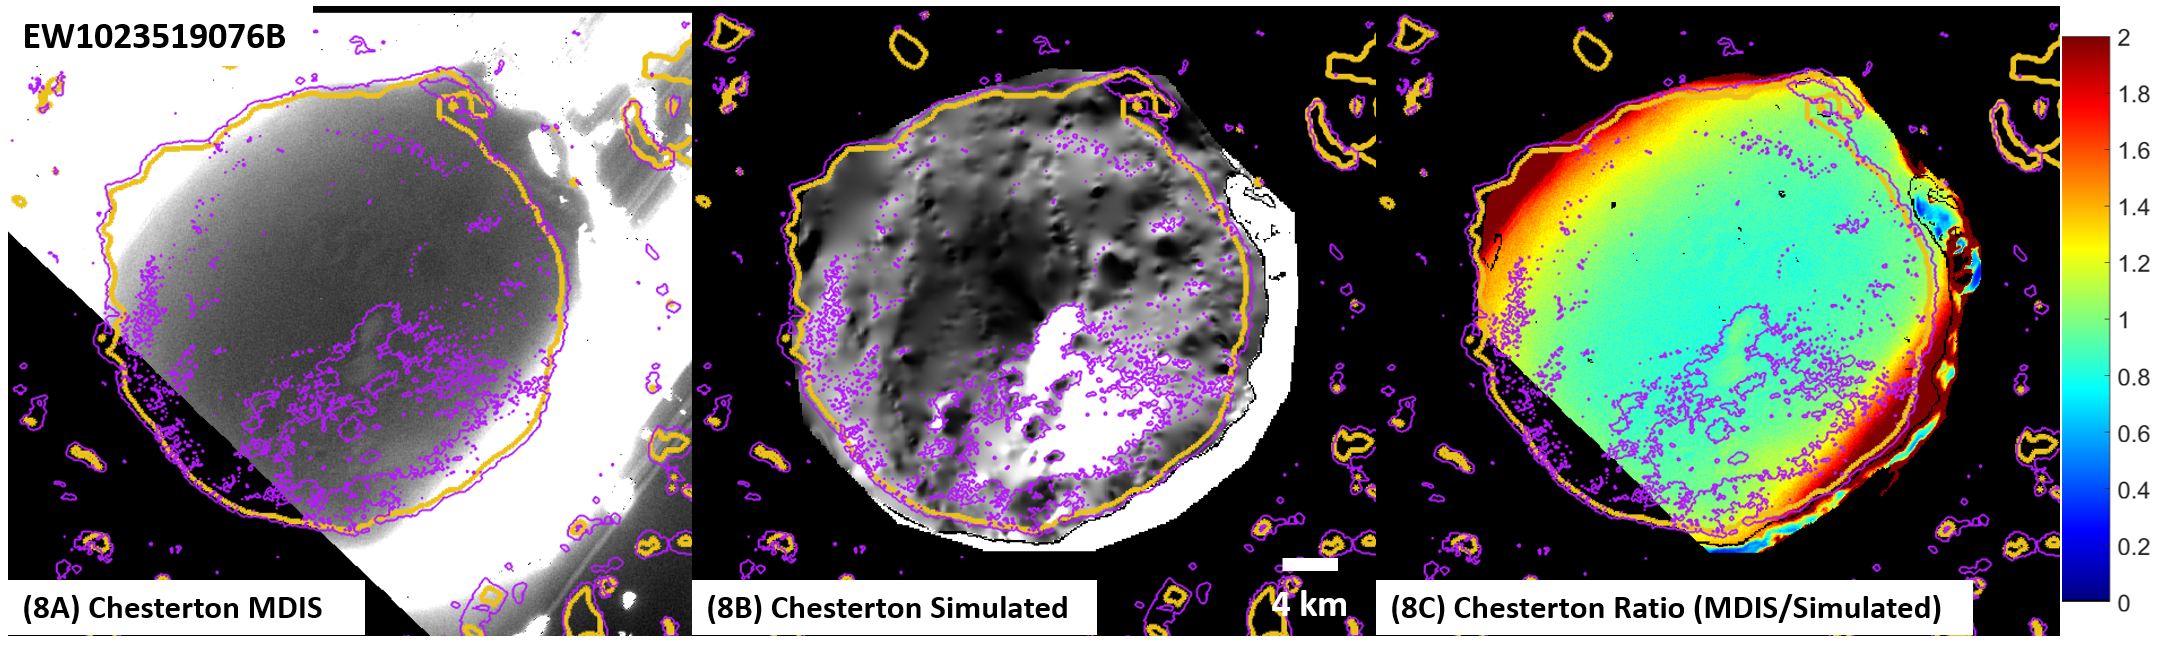
figure12_8abc.png |
MDIS, simulated, and ratio images for Chesterton. MDIS ID: EW1023519076B |
|
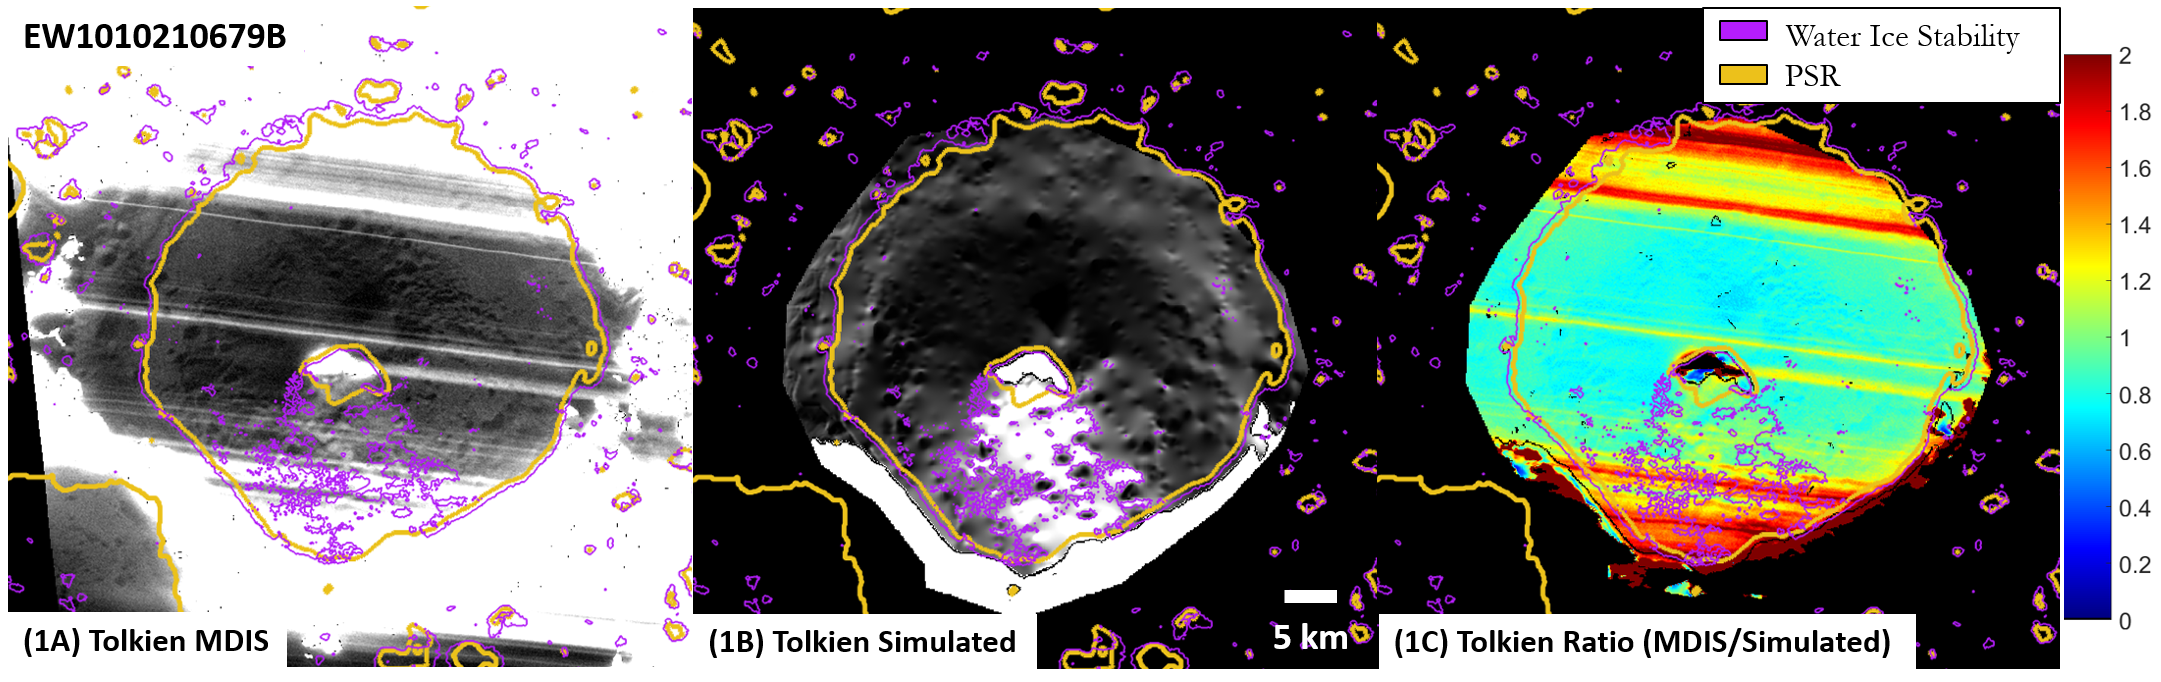
figure13_1abc.png |
MDIS, simulated, and ratio images for Tolkien. MDIS ID: EW1010210679B |
|
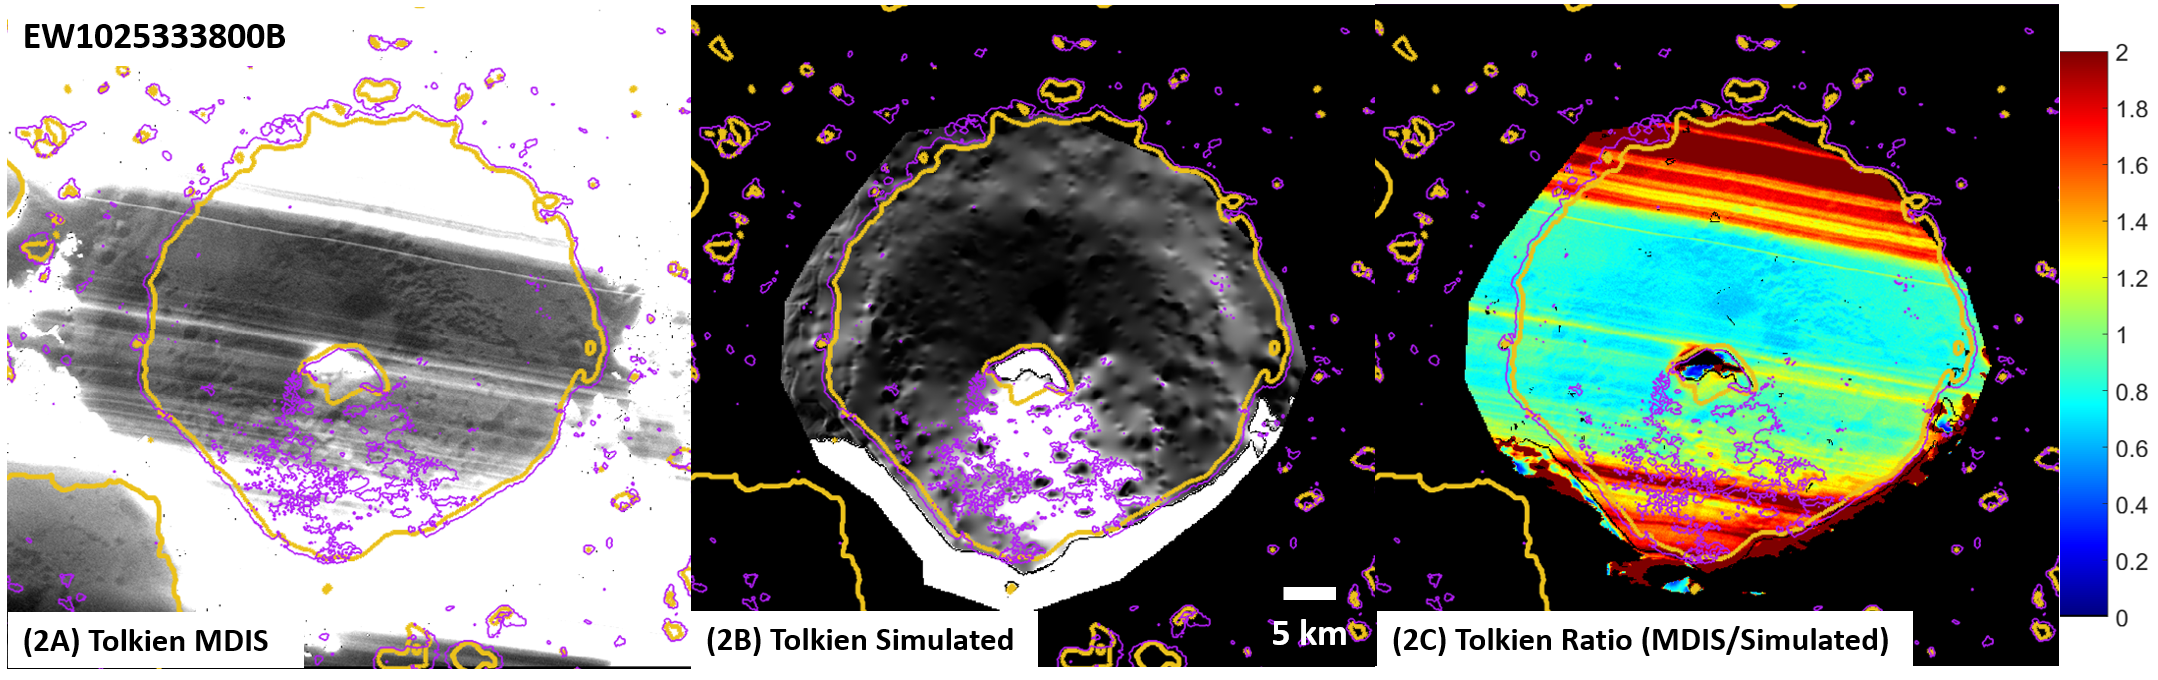
figure13_2abc.png |
MDIS, simulated, and ratio images for Tolkien. MDIS ID: EW1025333800B |
|
|
chesterton_stack_82mpp.cub |
USGS ISIS cub stack for Chesterton |
|
|
kandinsky_stack_94mpp.cub |
USGS ISIS cub stack for Kandinsky |
|
|
tolkien_stack_86mpp.cub |
USGS ISIS cub stack for Tolkien |
|
|
tryggvadottir_stack_86mpp.cub |
USGS ISIS cub stack for Tryggvadottir |
|
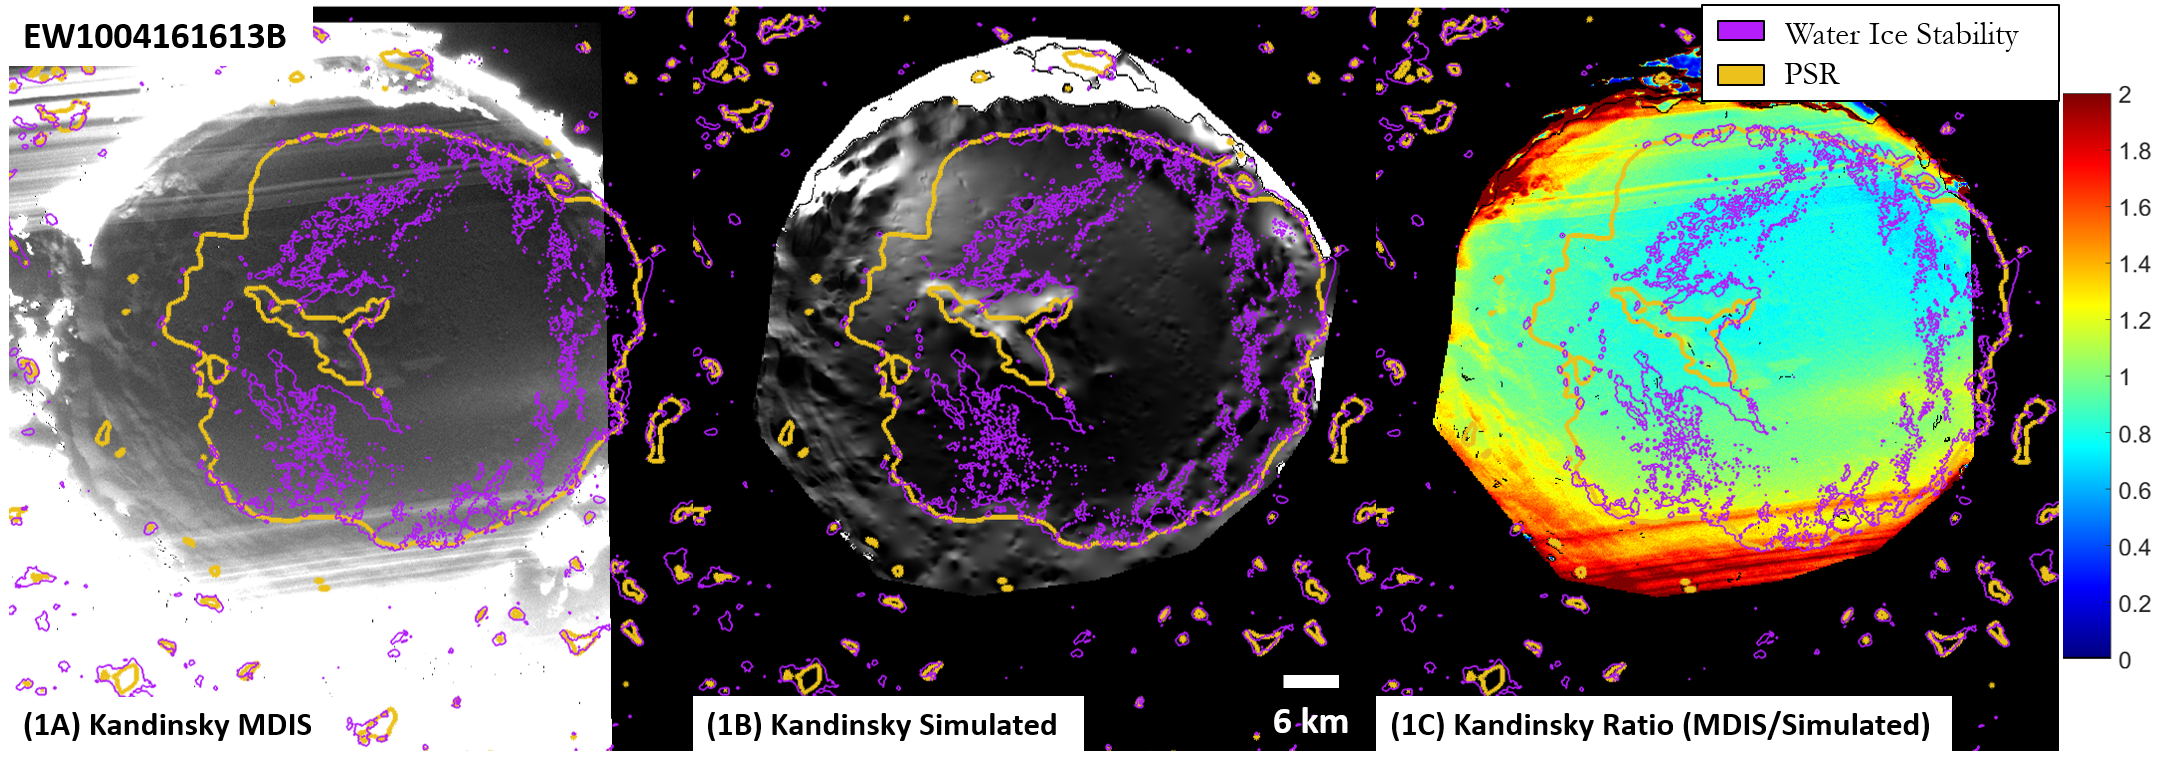
figure10_1abcv2.png |
MDIS, simulated, and ratio images for Kandinsky. MDIS ID: EW1004161613B |
